Greetings all,
I’m working on a PhD involving LIDAR and geodetics. In an effort to overlap my study and hobby, I’ve learned a lot about Digital Elevation Models (DEM). I refactored code from WA7BEN/Ben and N0QLR/Shane, to generate activation zone contours from high-precision DEM. It is efficient and robust to outliers, so I’m able to process large areas.
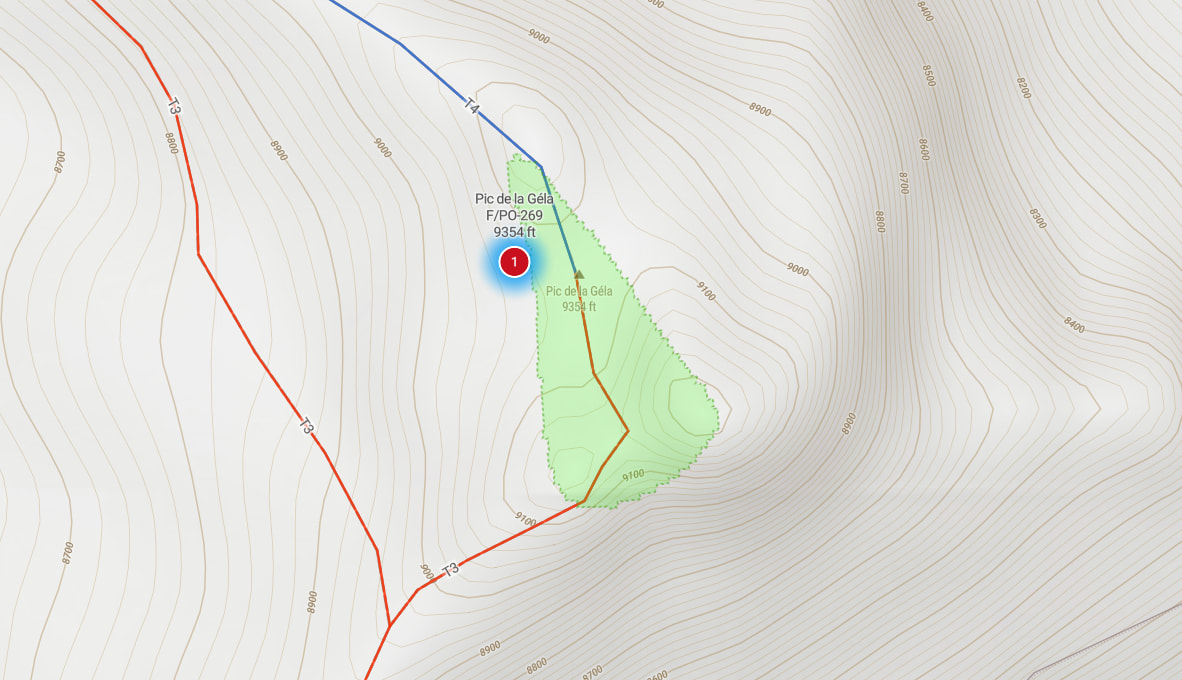
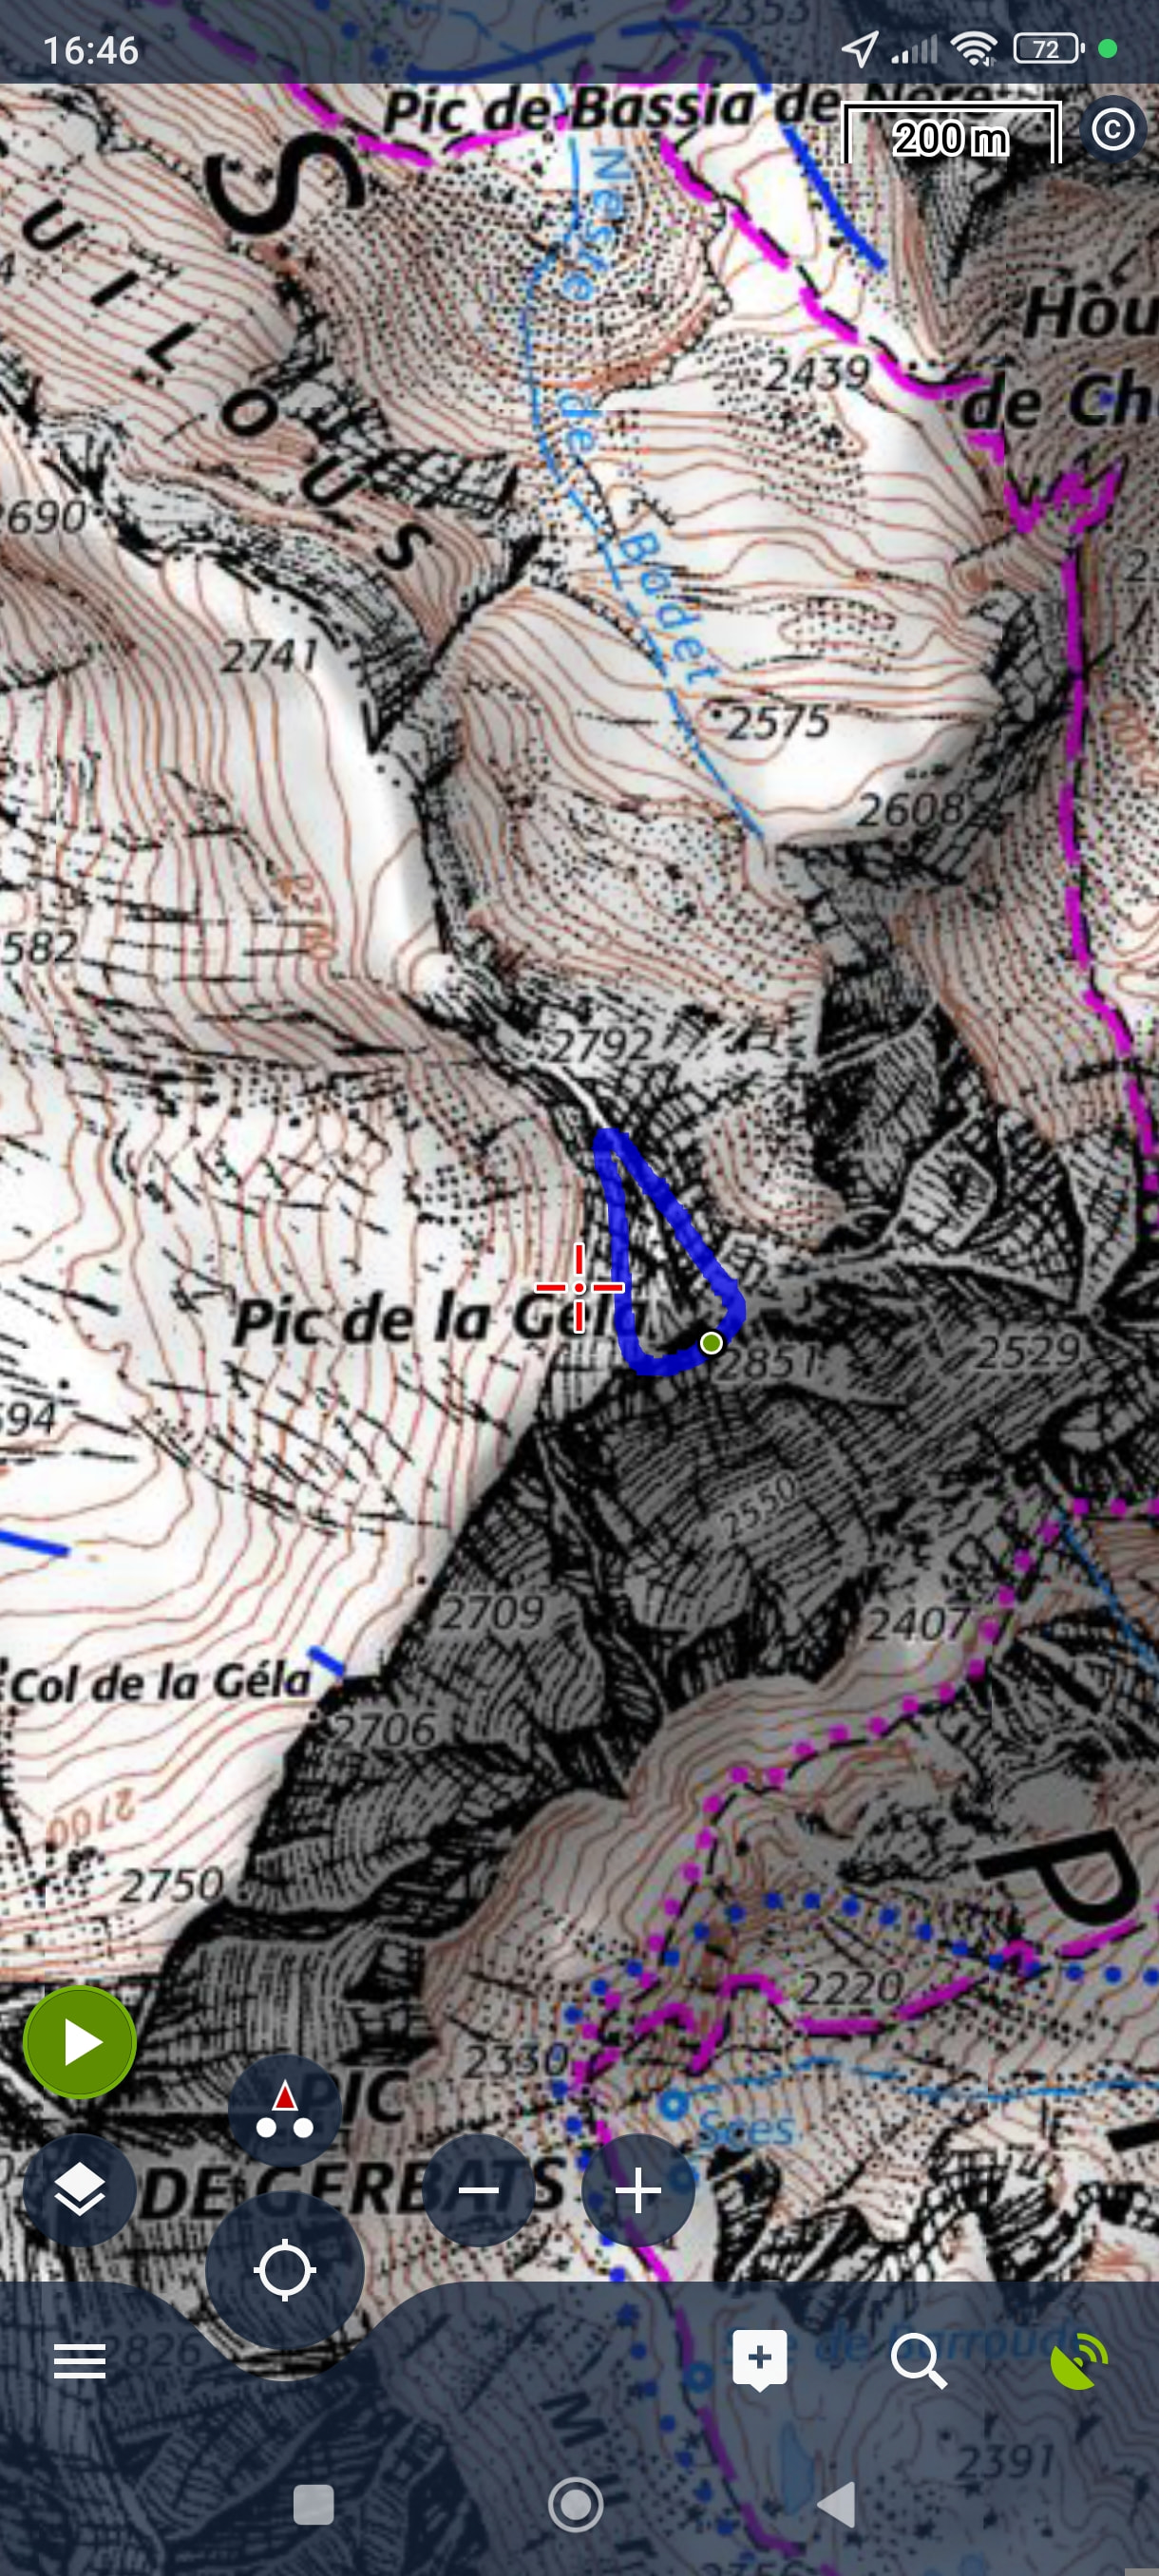
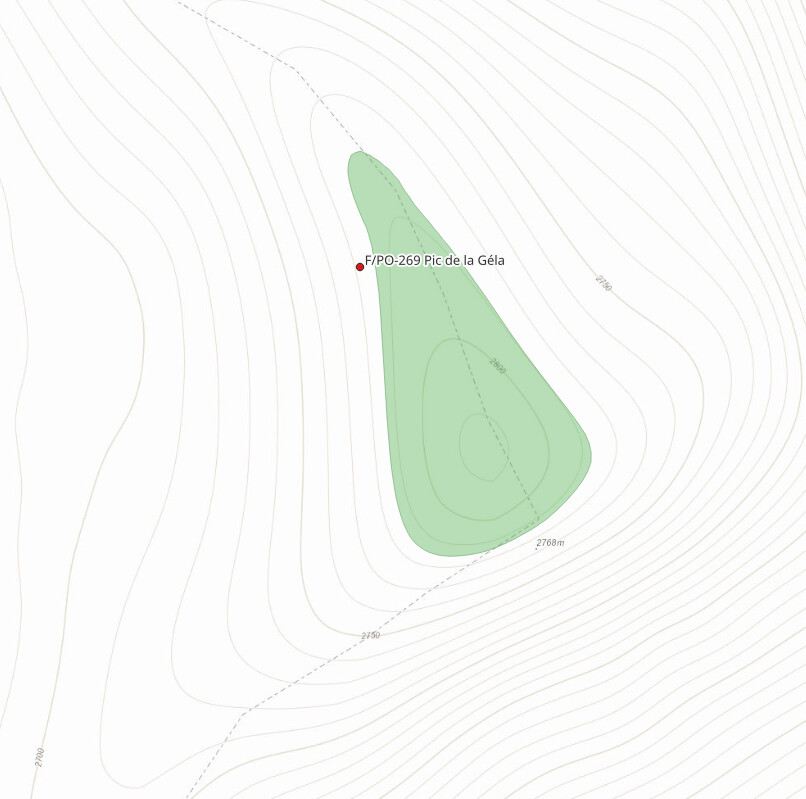
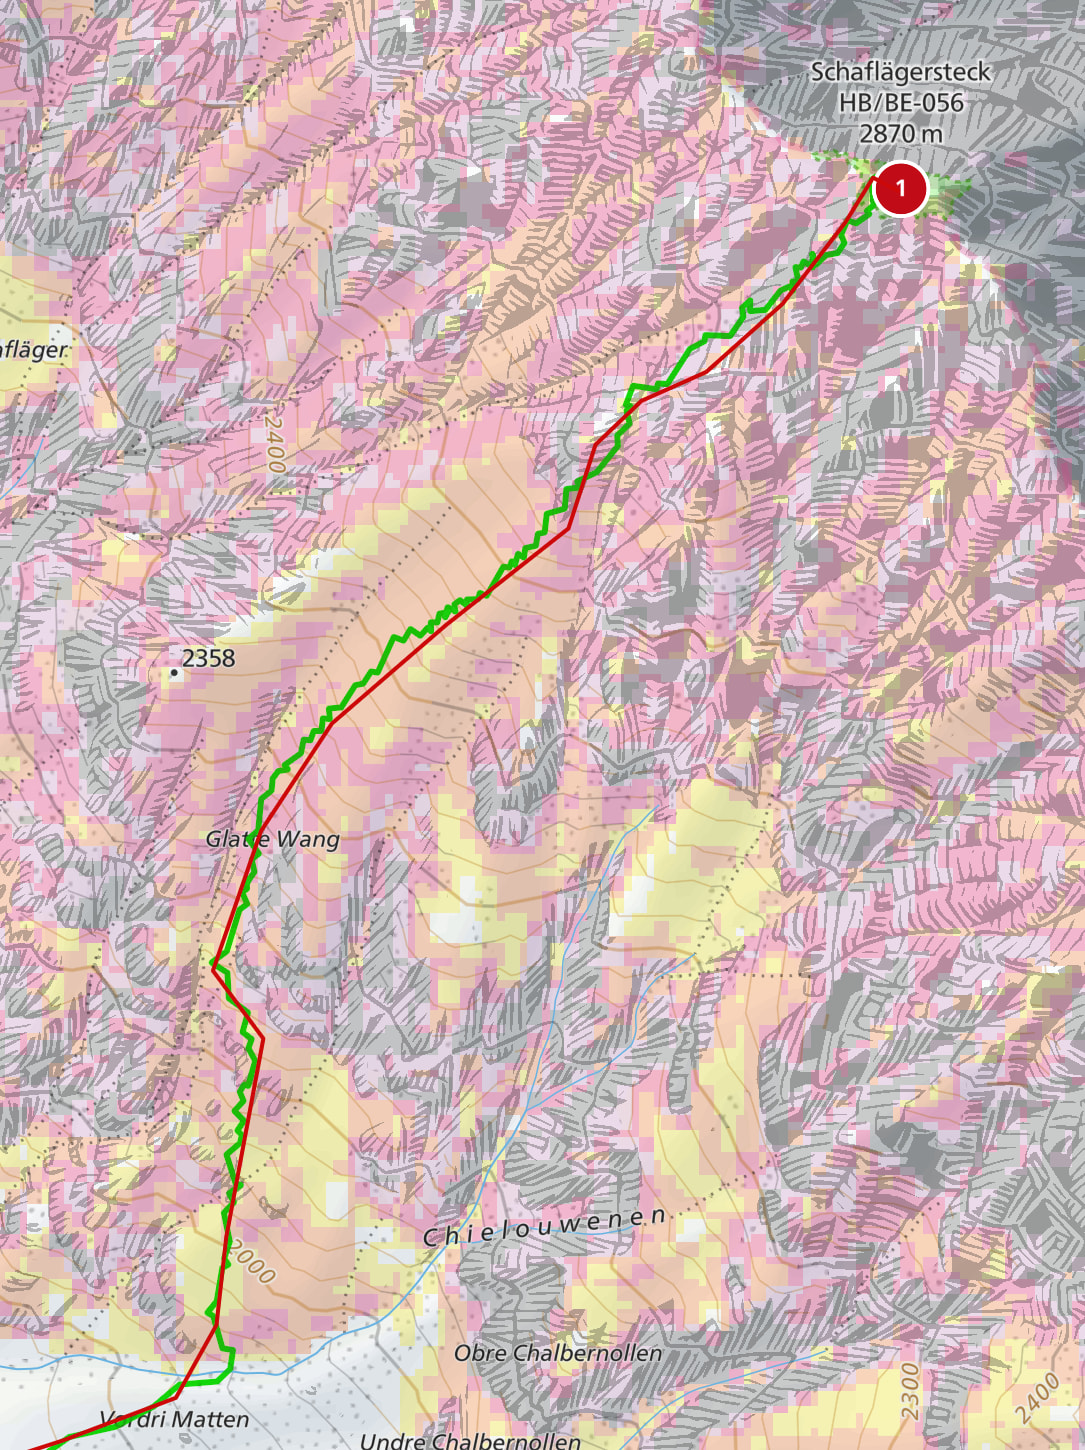
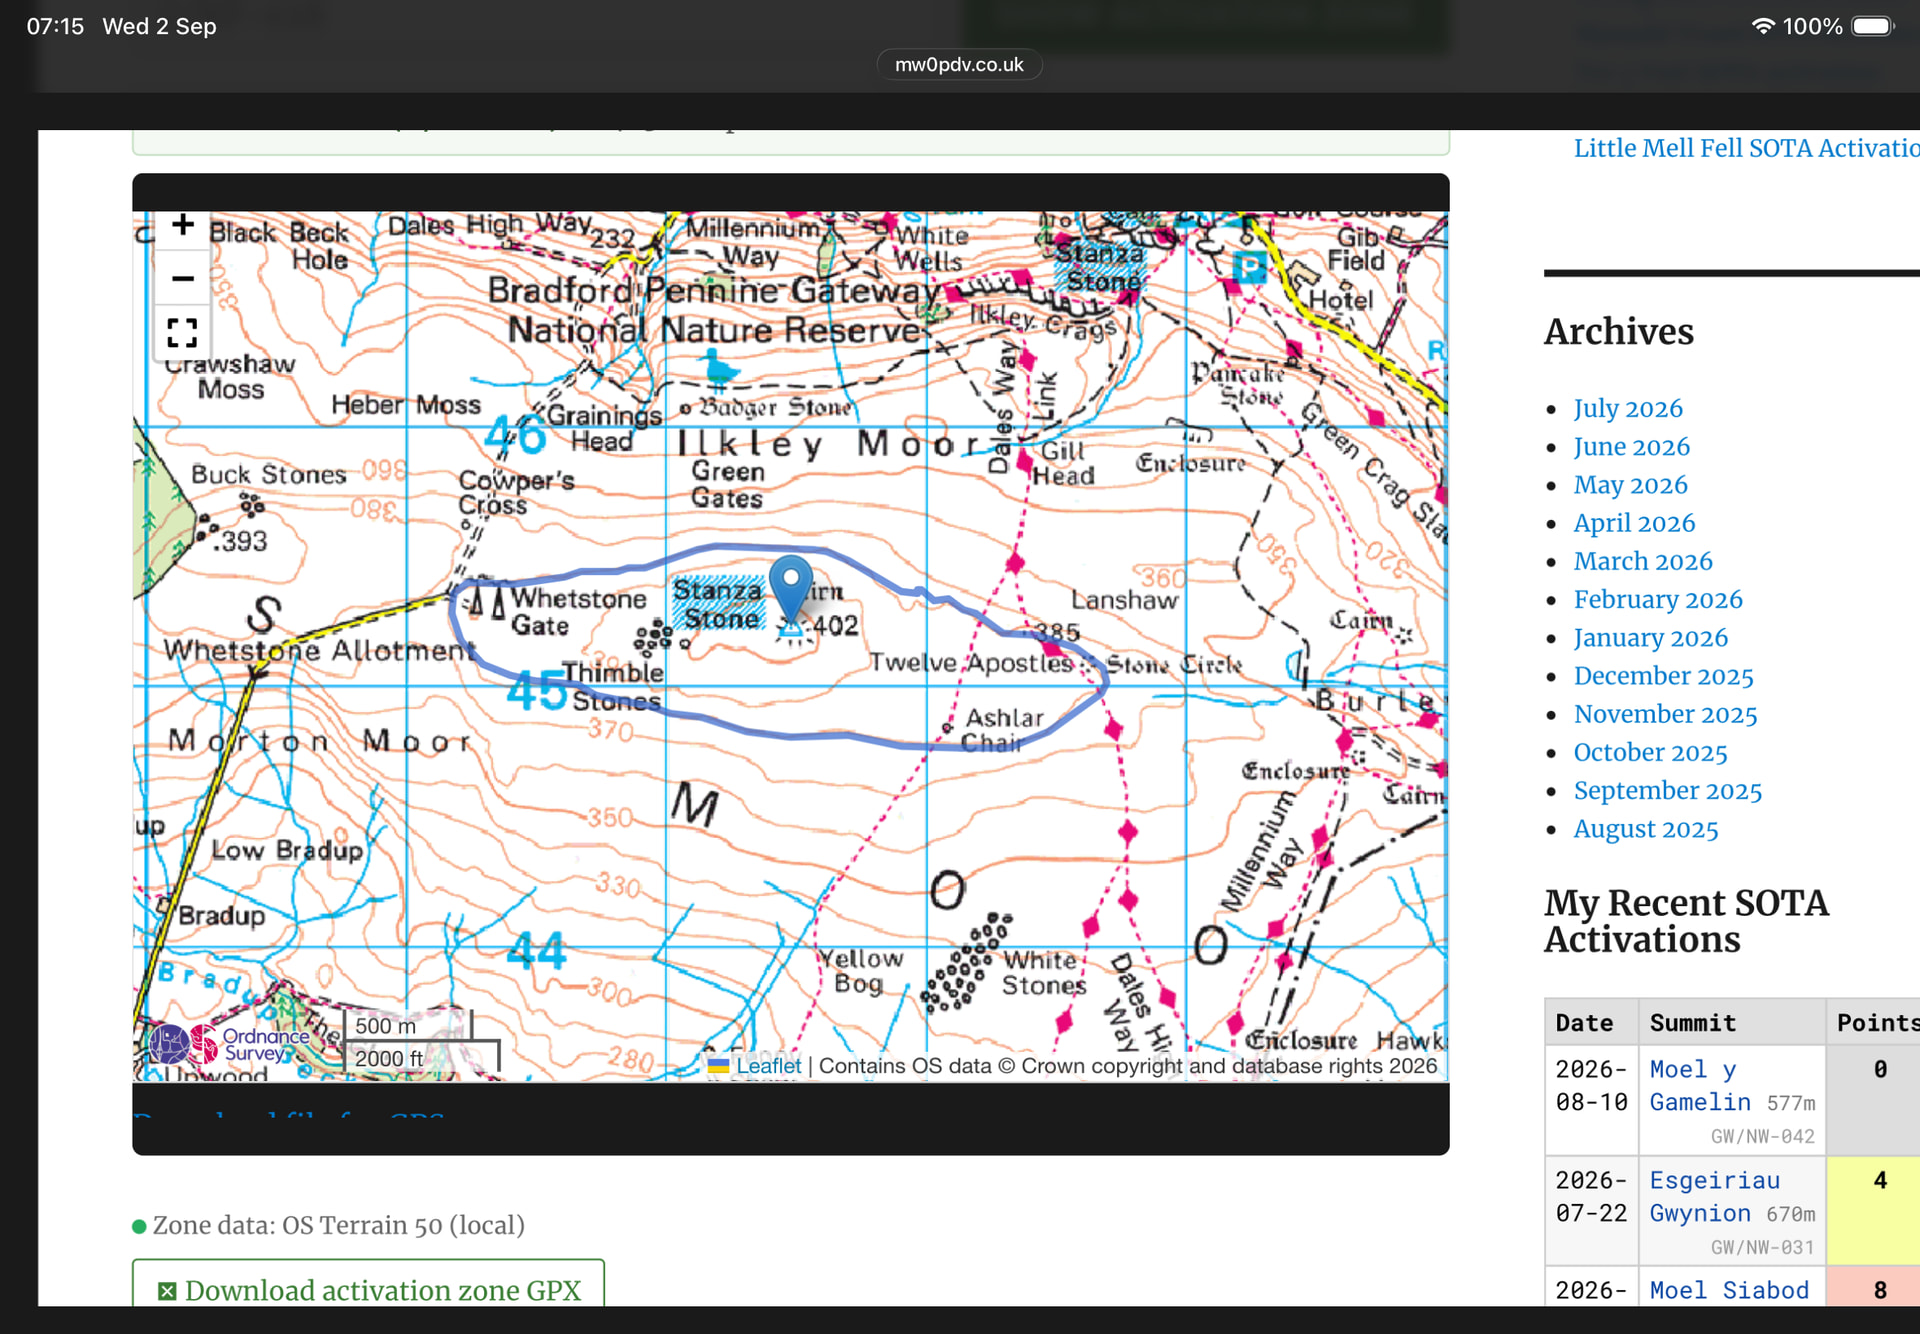
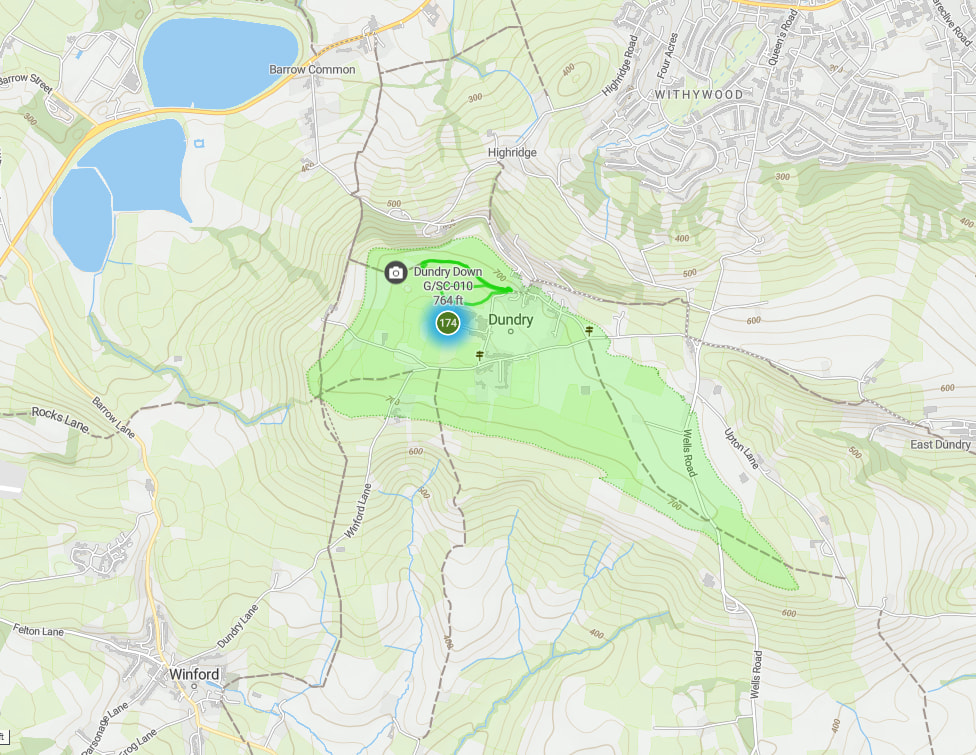
The results are uploaded to sotl.as under each summit’s page. I completed the US (including Alaska!) and have recently published summits for G, GW, and some for GM. The AZs are represented by a light green, dashed area. There is an “AZ” button at the top to download the data.
You can review my open-source code here. AI was used in development to ensure code quality; iterations with the LLM were short and based on my manual research and test cases.
Interestingly, the code ran over the entire UK with no reported errors, owing to excellent curation of those summits by the Association Managers - kudos! Alaska was much more complicated, with moving glaciers, high-latitude reprojection errors, and more. No DEM was available for much of Scotland; only 12% of summits are outlined as a result. I did not fall back to lower-resolution DEM. The minimum I accepted is 1m horizontal, 10cm vertical unvegetated precision at p=0.95. In vegetated areas, this is approximately a 95th percentile within 30cm vertical. No data is preferable to bad data!
Please have a look at your favorite summits. If you find bad data in excess of the stated precision in the US or UK, I’m happy to look into it if you just let me know. HB9DQM/Manuel (of sotl.as) can also direct these bug reports as appropriate to other curators in other areas. So far, six reports of bad data have revealed coordinate transcription errors in the official database, and terrain changes due to recent mining operations.
These AZ outlines are for your convenience in planning. For example: it was convenient for me to query that there are five summits in England and Wales whose AZs contain a pub. I am happy to provide that list, and buy the first round, in exchange for a plane ticket!
However - the AZs are unofficial. The activator on the ground must be the authority on the matter. As with Archimedes’ lever, an activator with a shovel and enough gusto can activate any summit from anywhere!
I also must discourage use of this methodology for measuring prominence or disqualifying summits. It is statistically difficult to disprove a prominence claim using this DEM, due to the nature of confidence intervals and lack of Gaussian point distribution in vegetation. AA3TZ/Tom and I wrote some on the subject. The extent of my project is to outline the existing summits.
Enjoy - I hope this is useful to you!
AD8IS/Mike