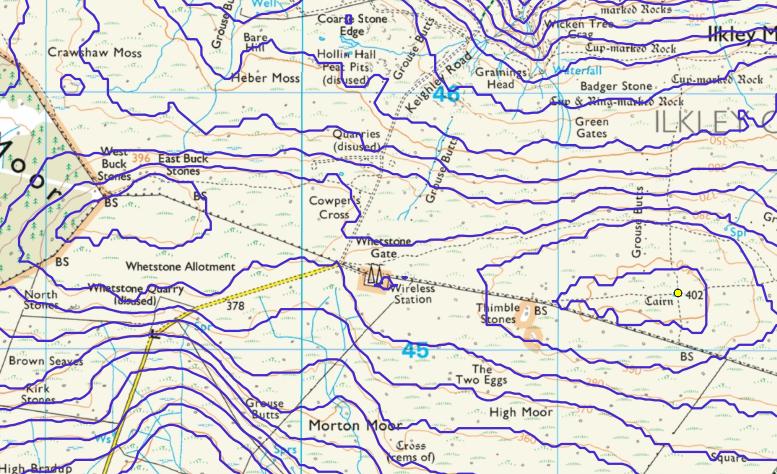
I’m trying to work out the extent of the activation zone on Rombalds Moor, in particular whether the high ground by the Buck Stones is included. The summit is 402m so the activation zone is formed by the 377m contour. The OS maps show two separate 380m contours around the trig point and around the Buck Stones top. So it isn’t possible to tell if the top is in the AZ as I can’t tell how low the col is. But the Open Topo Map (linked from the summit info page) shows a single 380m contour enclosing both the trig point and the Buck Stones top. This would mean the Buck Stones were in the activation zone. But how reliable is the data compared to the OS?
Hi Richard,
The OSM contours are primarily derived from SRTM data. The level of accuracy of SRTM is around the 10 to 20 metre mark. Whilst relative measurements over a short distance are likely somewhat better than that it wouldn’t be wise to rely on this for a marginal case like this.
I couldn’t find LIDAR data covering the summit, but made a contour from OSGB data. Here it is over an OSM topo map (acknowledgements to Openstreetmap contributors and Thunderforest for underlying map data):
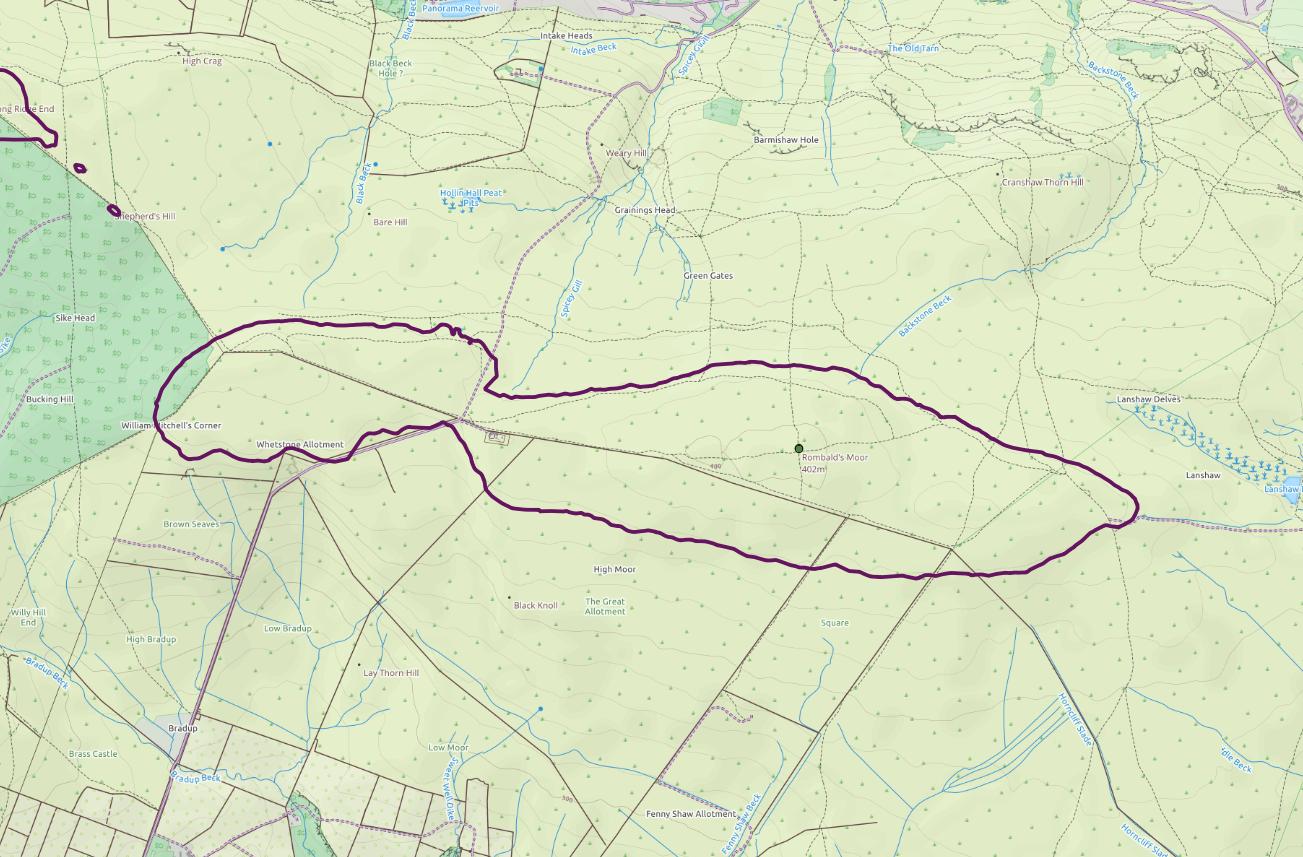
So, according to this you’re Ok. On the other hand, it looks like the drop is still very close to the limit. It’s about 23.5m, so only a metre and a half in hand. RMS error for this dataset in mountain / moorland areas is cited as 2.5m. So it’s better than odds-on that it is Ok, but there is a significant chance it’s not. Pending more accurate (LIDAR) data I’d err on the safe side.
1 Like
Thanks for that. I had to do some Googling to understand the acronyms! It’s as I thought - not reliable enough. I will stick to the “safe” AZ which is still very big.
And are these maps based on the same vertical datum? I would guess probably not.
Martyn M1MAJ
Martyn, you are right to draw attention to the importance of reference to a common datum. However, since British ODN heights only differ from gravimetric values by of the order of a metre the discrepancies are perhaps of second-order importance compared with other errors in SRTM (which is referred to WGS84 and its geoid). Indeed, looking at SRTM heights given for the sea around the G coast they sit nicely at 0m (integer values - in reality I think we’re meant to be sitting on about -0.8m because we’re in a local valley).
Anybody using different maps should always try to compare differences in elevation to answer a question like this. Don’t assume OSM’s summit elevation is what it says in the SOTA database (although here it is Ok). And it seems to me the OSM spot heights often don’t bear much scrutiny when compared with their contours!
In this case it actually looks like SRTM tracks OSGB contours quite well, except at that col its dropping a bit too much. Perhaps more of a noise-like occurrence here.
Background image ©Crown copyright 2018 Ordnance Survey. Media 032/18
10-m contours from SRTM
2 Likes
I love all of this mapping detail discussion.
I wonder what the surveyors of the 1700’s with basic theodolites would have made of all of this data and the way it is gathered.
3 Likes
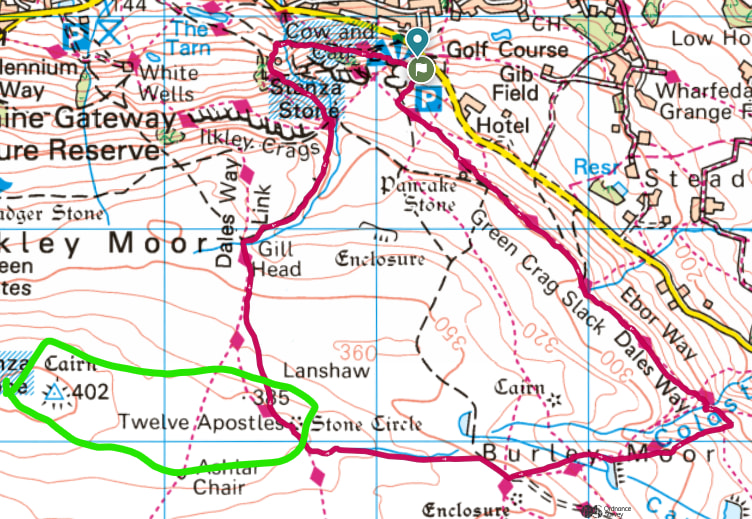
On Tuesday (14th) my wife and I would like to do a 7.7km circular route starting at Ilkley Moor car park and going via Cow & Calf, the 12 Apostles, and Stanza stone. I would like to do a 2m FM/SSB/CW activation of Rombalds Moor G/NP-028 (402m ASL) on route. I would prefer not to have to deviate much if at all from the walk.
(C) Crown Copyright 2026
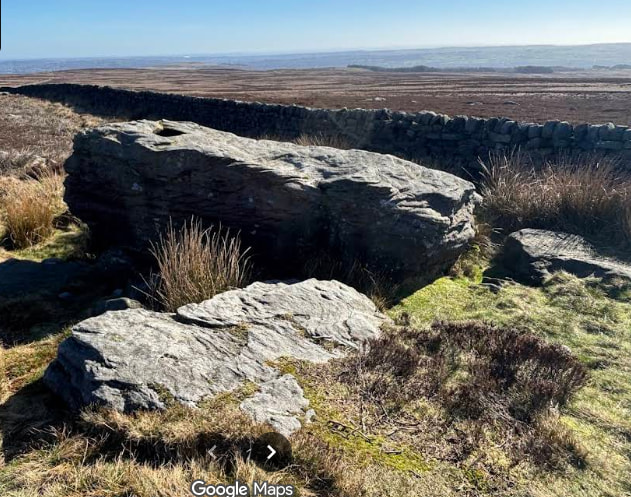
The 12 Apostles stone circle (at 385m ASL) appears to be well within the AZ and I was wondering if there’s any shelter (e.g. stone walls) nearby where I could do VHF radio whilst my wife and dog shelter from the wind.
Also, any advice on the Ilkey Moor C.P. please, e.g. how many spaces? How popular / how quickly in the day it fills up.
73 Andy G8CPZ
If you look at the 1:25000 map (Map of Ilkley Moor, West Yorkshire [Summit] and click the + sign) you’ll see where the wall is. I usually take the path marked from the trig point south that leads to the wall. Unfortunately it is a slight deviation from your route. You might find some shelter near High Lanshaw Dam and there are boulders in random spots but I’ve never gone that way for an activation so can’t say if they will help you.
By Ilkley Moor car park I think you are referring to the Cow and Calf car park (just down the hill from the pub of the same name). It’s reasonable size but does get very busy. However, on a Tuesday in term time I think you will be OK. There is also a lot of other parking on the side of the road near and beyond the pub (away from Ilkley).
1 Like