Nothing wrong with the technology per se.
The algorithm used is not suitable for the job and it’s likely the data it was using is not accurate enough either.
Nothing wrong with the technology per se.
The algorithm used is not suitable for the job and it’s likely the data it was using is not accurate enough either.
Thanks for posting this here John - m0vaz!
The activation.zone web app is fairly new and in beta, so I did a soft rollout to the SoCal SOTA mailing to get some feedback. Much to my delight, the feedback has been positive and has led to bug fixes and new features. I’m actively working to improve it, so any suggestions are welcome! I figured folks would share this and that word would eventually spread to the reflector ![]()
For more details, check out the SoCal SOTA forum post: SOTA Activation Zone Estimator - Web App
FYI - the project is open source, so feel free to make pull requests or open issue tickets for bugs and feature requests:
Thanks for pointing this out G0AZS! I’ll dig into why this is happening and should have it fixed soon.
San Bruno Mountain (W6/CC-072) has an interesting AZ in the tool.
Absolutely!
When I originally set out to write this program, I drafted up the following three requirements:
(1) The service must be free (that really limited me to open source projects and mapping APIs)
(2) Must be relatively quick and “accurate enough”
(3) Should work for any summit in the world
#3 limited me to 30 meter (1 arc sec) Depth Elevation Maps (DEM), so the results are pretty crude. The goal here is to give folks a quick look tool for visualizing the AZ that’s “good enough”.
Google Earth flood tools and topology maps are the next best thing.
…and that’s just one step short of bringing a total station with you to top of the summit. At that point you’re really just doing Surveyors on the Air.
Hi Ara,
As a rough guide, this is way, way easier than using the Google Earth flooding tool and more practical when on a summit. Thank you.
One request - on a PC browser the screen layout is fine but accessing using a browser on a Smartphone, the map part is initially only partly visible on the bottom of the phone screen. Is it possible to re-arrange the screen layout so that the calculations box (the one under the text “Estimated Computation Time”) comes after the satellite picture, please? While it is possible to scroll the complete page up (as well as the satellite picture within its box), this then loses the summit data off the top - I’d rather have the calculations box off the bottom of the default screen so that only limited scrolling (if at all) is needed.
I hope this will be possible without a complete redesign - if it requires a lot of work, then leave it as is.
Thanks & 73 Ed DD5LP.
P.S. I already use a modified surveyors tripod to support my 10 metre mast on some summits, so Surveyors on the air, isn’t too far off HI.
Definitely! We currently have two tickets open to add mobile support:
https://github.com/arkorobotics/azgen-web/issues/7
https://github.com/arkorobotics/azgen-web/issues/8
Ara, it would be good if you could you add some kind of alert box that sits over the image once generated that the user has to dismiss. It needs to say that the area shown is indicative of the AZ but not the definitive AZ because the data used is not accurate enough. Not everyone will be aware that this is the case and some will believe they are properly following SOTA rules about vertical drop when then may not be. This is especially true since the algorithm in SOTA Goat told an activator he was in the AZ for a Welsh summit when he wasn’t.
We could make it more ‘interesting’ xkcd: Sloped Border
I would hate an alert box, but I agree that labeling it as “approximate” would help. Also might list the accuracy of the DEM data, something like “errors of up to X m are possible”.
A story from a product I worked on. The Ultraseek search engine did not account for deleted documents when giving the count of matched documents. This was a huge speed boost, but every few months, we’d get a bug report that the engine said there were 16 results but they only could see 15. So we changed the UI to put the word “about” in front of the number. Never got another bug report about that.
More accurate data would be nice, but I think the tool is really useful for planning as it is. Thanks!
wunde
Congratulations for this useful app.
One thing I’d find really cool is seeing my own position on the map where the AZ is being plotted, assuming I have the GPS position enabled in my smartphone. This would tell me if I’m too close to the border line and bearing in mind the inaccuracy of the plotted AZ contour, I’d better get further inside the AZ to make sure I comply with the AZ rule. Would this be possible?
Thanks and 73,
Guru
I have had a look around at some SOTA sites in UK and the one that is missing is Snowdon, haven’t checked any of the Scottish one’s pleased that my local summit has a good spot for HF!
Programming it so that only the polygon containing the summit is plotted would perhaps solve the problem and shouldn’t be that difficult.
First, Ara… thanks for building this; even in its current rough-and-ready state, it is quite handy!
That SOTAgoat story is a good reminder that automated tools like this can supplement trip planning skills, knowing how to read a topo, use a compass, take a bearing etc but they don’t replace them. As with phone-based mapping and GPS, trust but verify!
Cheers Bill K7WXW
That’s a good point. Though I’d want to balance how that information is displayed. I think an alert pop up every time may be a bit too annoying, but perhaps I can add a second line after "Estimated Computation Time: ~1 min " stating “AZ is not definitive and is a rough estimate within 30m”? Is there a better way to word that? I have an “About” button at the top which goes over this in a little more detail, but yeah, I agree. We need to label this so folks don’t get confused.
GW/NW-001 (subject of another thread) kills your Jupyter notebook too, right at the last cell.
Anyway, I’d misunderstood - so this is using SRTM, right? Not GE eles.
Tongue in cheek I trust! SRTM (if that’s what you’re using) can easily be 10m off what we have in the database at the summit position. You can probably do a bit better than that with a total station. ![]()
Yes please. It’s only indicative. And I’m nervous about your adding a current position icon. Some might imagine edging that icon just over the line is enough to be in the AZ when in reality the errors are simply too great!
You might consider using ALOS as an alternative data source, extending your coverage to high latitudes. Still not accurate though.
Definitely joking about the total station ![]()
As for http://activation.zone?summitRef=GW/NW-001 , this is a known issue that I’m working to resolve: GEOMETRYCOLLECTION EMPTY · Issue #1 · arkorobotics/azgen-web · GitHub
and yeah… data accuracy is a huge problem. If there’s enough support, I might just bite the bullet and purchase a subscription to higher resolution DEMs. The question will always remain, what’s good enough? This is why I’ve been adamant about calling it a ‘quick look’ tool and not an official or accurate tool.
Serious money. I’d like some myself!
But still it doesn’t address the inherent inaccuracies with SAR such as shadowing or picking up trees rather than the ground.
Not by any means. I usually spend a fair percentage of my planning time on getting the parking spot firmly in my head and making sure the GPS is suitably programmed. I drive for hours to activate summits and the last thing I want is having hassle parking up which would spoil the day before it has started. Reading reports on established routes up the hills with the OS maps already printed off in front of me takes up the most time. I try to find photographs of the route and summit whenever I can and look at aerial views. However… the phrase “it doesn’t look like this on Google Earth” has been uttered on many an occasion! ![]()
As for determining the extent of the AZ, it doesn’t usually concern me as most of my activations include 2m and being close to the summit is where I need to be. There is of course a sense of achievement when you get to the summit, something I personally wouldn’t feel if I stopped short. Of course there are some instances where the summit is inaccessible, so the nearest practical position is what I look for.
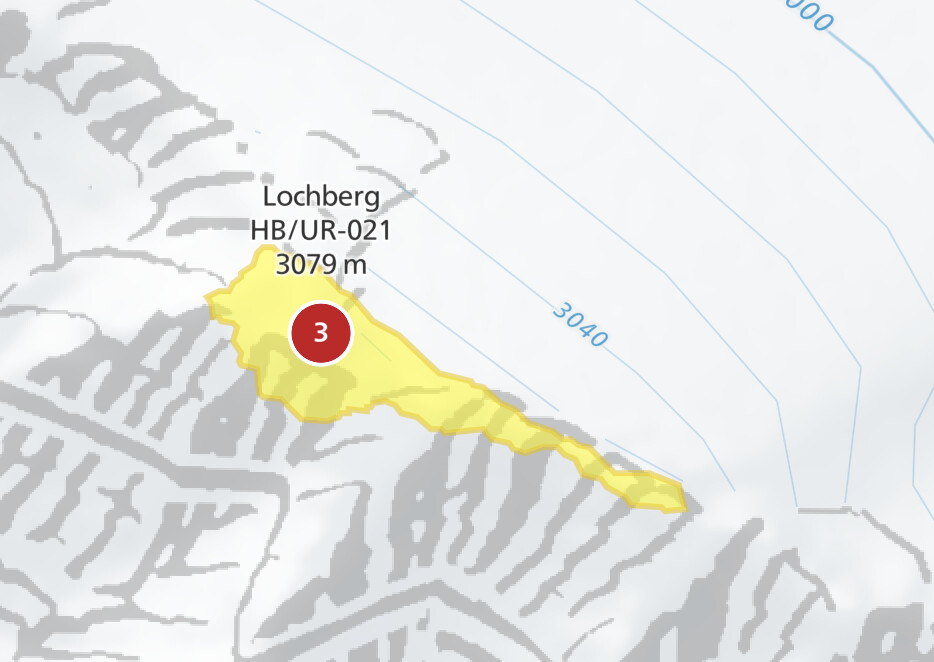
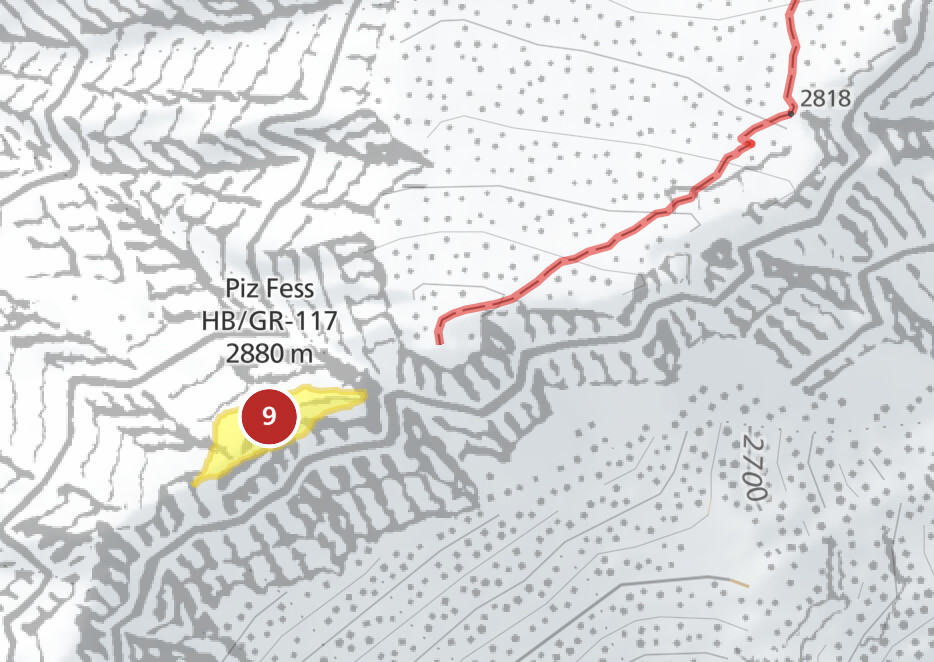
Ara’s work motivated me to see what’s possible using high resolution DEM data. For HB, this has been made available for free half a year ago as part of an Open Government Data initiative. swissALTI3D has a spatial resolution of 0.5 m and an accuracy of ± 0.3 – 3 m (1σ), depending on the region.
SOTLAS can now show activation zone boundaries calculated using this data. If you want to try it, simply open the map options menu in SOTLAS (top left corner), change the map type to one of the swisstopo maps, and enable the “Activation zones” option. Perhaps we can also add such polygons for other associations in the future if free high resolution DEM data is available.
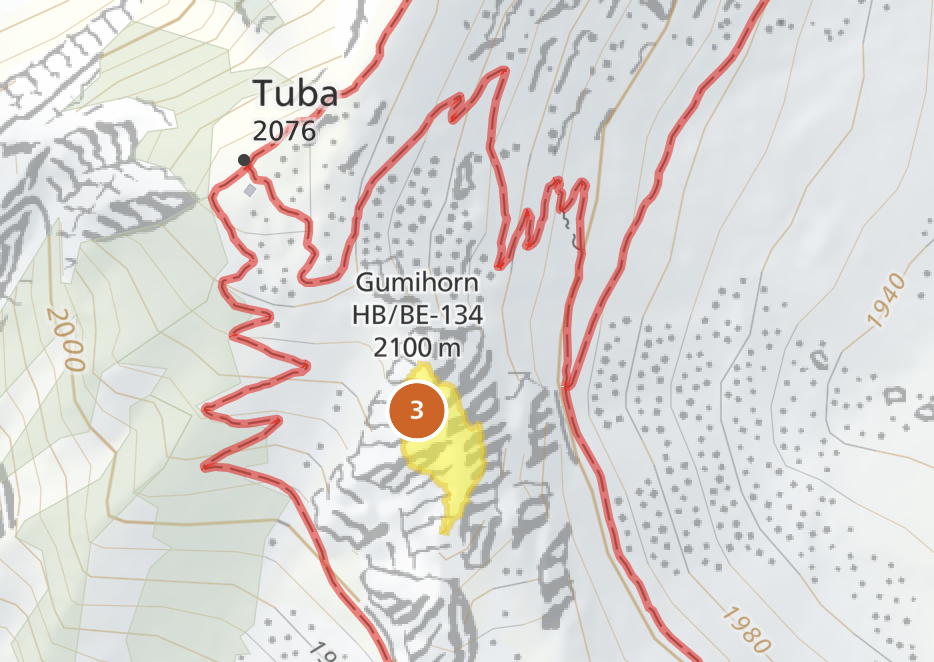
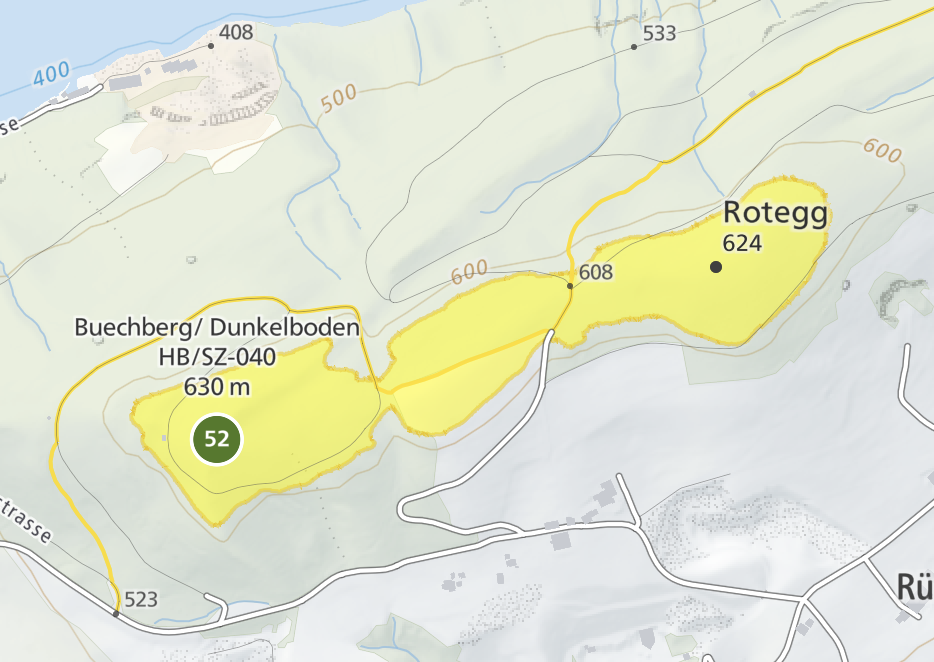
We now also know which HB summit has the smallest activation zone. It is this one:
73, Manuel