I second you here, Gerald. I do very much enjoy CW but have found it significantly more tricky on the summits this winter than I do when sitting at the PC copying at home. Cold hands and noisy wind have been two of the biggest drawbacks. I found using a straight key quite nice as I don’t send too quick, which in return folk tend to respond a little slower, which makes life a little easier.
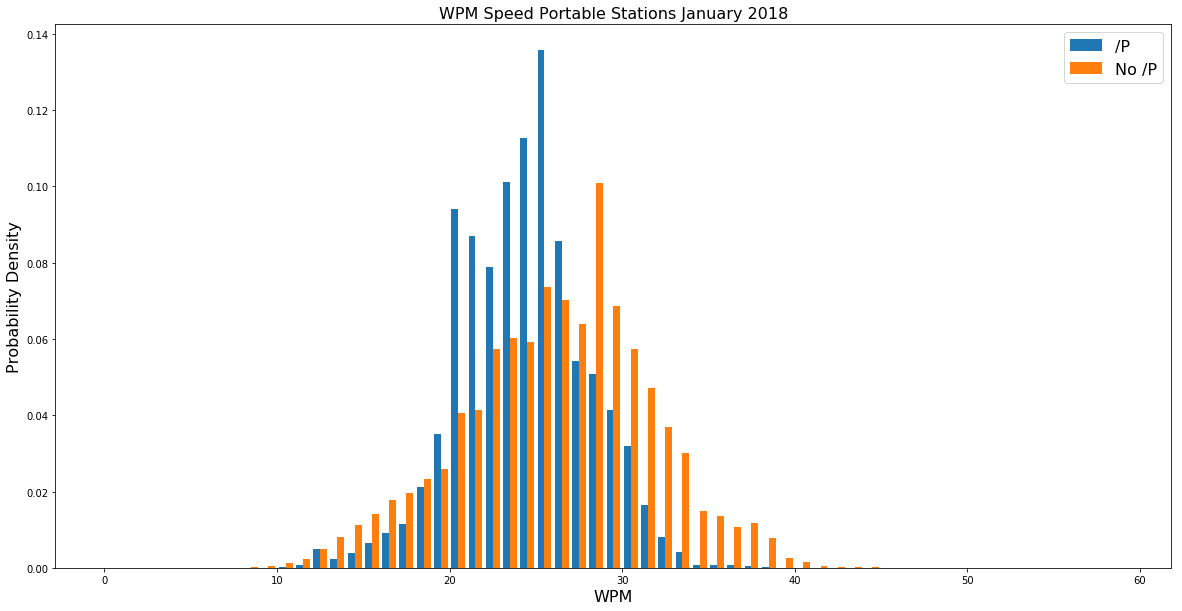
Here is a new analysis, comparing the speed of portable stations (defined as containing /P in the dx callsign) vs. home stations. Again, please note that for the sake of simplicity, the histogram is based on the number of spots, i.e. stations spotted by more skimmers than others are overrepresented. But I don’t think this makes for a huge difference. This time I just took the RBN data for January.
One can see that portable operators indeed send at slower WPM.
73 de Martin, DK3IT
2 Likes
…at least for speeds over 18wpm. At 18wpm and slower, there seem to be more non-/P stations than /P stations.
(Of course, /P doesn’t necessarily indicate SOTA-like operating, and not all folk operating in a SOTA-like manner necessarily use /P, so it’s probably not worth drawing too much detail from the chart.)
Back in 2015 when I was trying to figure out what sorts of speeds were used where, I just counted unique callsigns per speed (or speed range). If you called at 15wpm and at 18wpm you’d get counted twice. If you only called at 15wpm you’d get counted once. I figured that way I was probably doing as much as I could to count individual operators as the RBN data would allow. There’s no way to determine from the RBN data whether operators work at speeds other than the ones at which they call.
So I should feel pretty good about myself being so far off the bell curve with my blistering 12 wpm. If I calculate that properly, I’m close to two standard deviations from the mean. I’m feeling extra special today.
1 Like
95% of people are within 2 SD’s of the mean.
I am. A semi-serious contest station can easily call CQ 5000+ times during a 48-hour contest. And there might be 1000 such stations doing so in the big contests. And they are probably higher power/bigger antennas/stronger signals than the average station. The data is therefore highly skewed to reflect these high speed CQ machines during contests.
Speaking for myself, I run 10 wpm faster during contests than I do for SOTA.
An easy way to filter out contest skew is to do weekday or WARC band sampling.
73, Barry N1EU
2 Likes
A difference of at least 5wpm was clearly evident (along with a much larger number of operators active) in the analysis I did over two days back in August 2015. Curiously, even the WARC bands showed faster activity during the contest day, though not by so much.
Hi all,
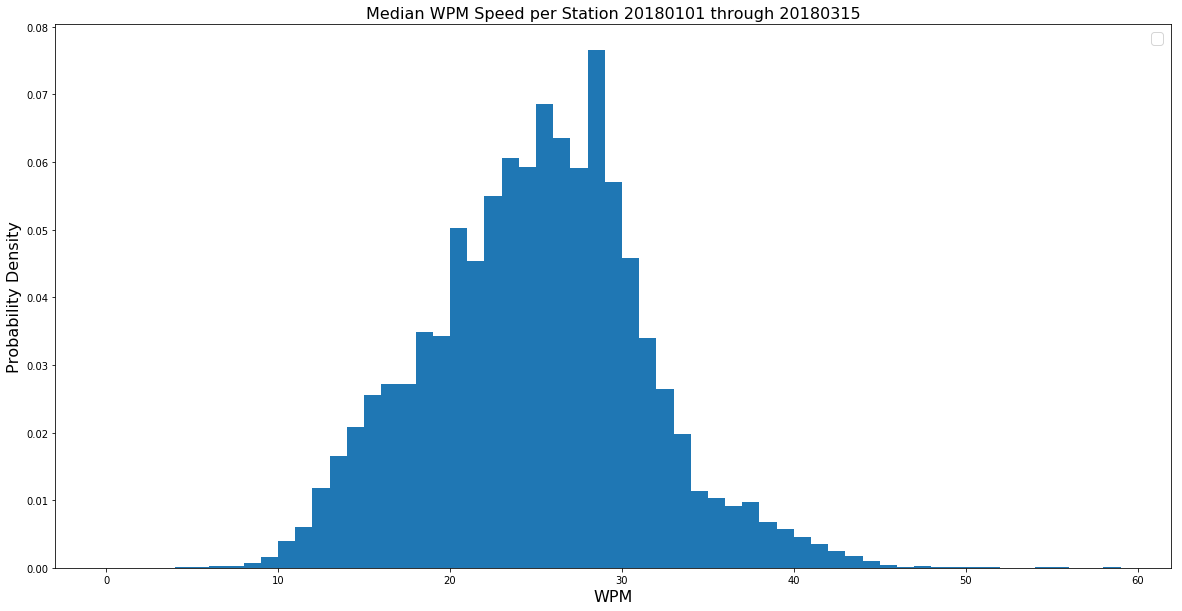
in order to compensate for the higher number of spots for strong and/or fast stations, I generated a new analysis: This time I determined the median CW speed of all spots for the same station. A quick pretest indicated that the min and max values for most stations are very close to the median.
Here is the histogram for all spots between Jan 1 - March 15, 2018.
73 de Martin, DK3IT
Hi all,
I also looked into how much the WPM speed per station in the entire set of spot data for January 1 - March 15, 2018 varies, i.e. whether stations more or less use the same speed for calling CQ consistently. In the total spot data, there are 80,977 unique callsigns.
1. Distribution Properties of Absolute Standard Deviation
(all in WPM)
mean         1.823986
std          1.751155
min          0.000000
25%          0.707107
50%          1.414214
75%          2.402952
max         27.577164
Essence: Half of the stations vary their speed by at most 1.41 WPM for 68 % of their spots (not CQ calls, because that would require aggregating all spots for each call, e.g. by time-stamp. I did not do that because it was a bit more effort, and if we assume that the number of spots is not systematically different for somewhat slower or faster speeds, that should not make a big difference).
2. Distribution Properties of Relative Standard Deviation
(in %)
mean         0.076927
std          0.074702
min          0.000000
25%          0.030612
50%          0.057936
75%          0.099276
max          1.279527
Essence: Half of the stations vary their speed by at most 5.8% for 68 % as per the spots of their CQ calls.
Martin
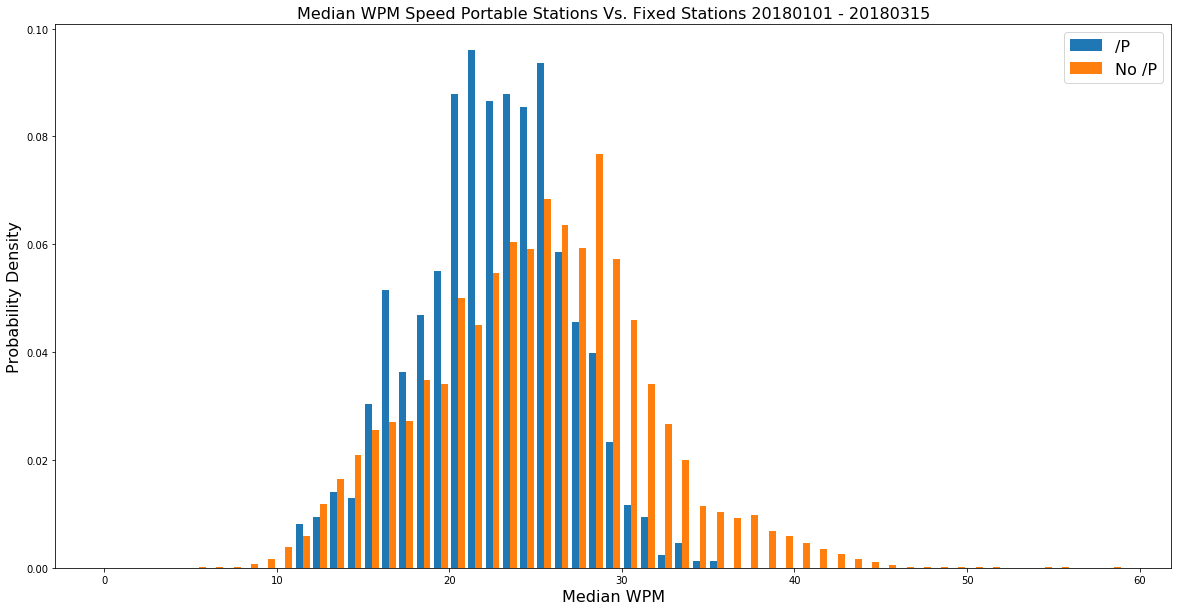
And here is a new comparison of CW speeds between portable stations (ending in /P) and fixed stations (not ending in /P), now based on the median WPM speed per callsign, not the median of spots (but it does not seem to make a big difference). I am aware of the fact that some people omit the /P suffix when operating portable, and that in some countries, other suffices are being used (I saw at least /P4 in the data).
Here is the respective chart:
73 de Martin, DK3IT
PS: My earlier analysis based on spots was flawed, because I considered all callsigns containing /P to be portable, but there can be CEPT-prefixed stationary callsigns (like OE/PA1XYZ or similar). So I am now checking whether the callsign ends with ‘/P’.