I have something for the management team to consider and will welcome comments from chasers and activators. I think it would be useful to add a link for Solar-Terrestrial data to the SOTAWatch site. I refer to the data fairly regularly to see what the chances are of making contacts that particular day. It would be nice to have a link right on SOTAWatch instead of having to go to a non SOTA site to find the information.
Hi Ron,
Quite a lot of solar propagation predictions and measurements of what is happening in the Ionosphere are location specific and while SOTA is a world-wide scheme how would we deal with data different for the US to Europe to Australasia to South America to Russia etc.?
Perhaps you can give some specifics of what readings you are referring to?
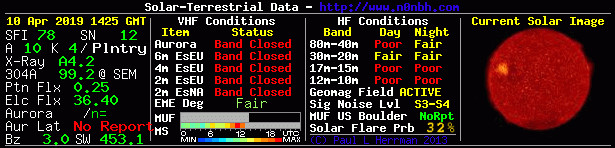
Wow, a lot to think about. I was thinking in simpler terms. A link that shows the common indices such as solar flair index, sunspot numbers, K index, and A index. As far as predicting propogation between different parts of the world, I wasn’t interested in that. Here is a graphic of what I was thinking (not current):
That information comes from the website HF Propagation and Solar-Terrestrial Data Website and it gives instructions how to add a link to your website. There is no fee as long as credit is given. I am sure there are other sites that have similar information.
Hi Ron,
I thought this might be the data you were referring to. It is in several areas US centric with e.g. the MUF coming out of Boulder Colorado and so is not completely relevant to other parts of the world. In Europe we have Belgium, UK and France based sites that give us information, in Australia the Government has a site that is second to none!
So why not simply add the sites that are relevant to your part of the world as a pull-down from the bookmarks toolbar of your browser?
I can add it to my browser and will do that. I was just thinking it would be useful for other users, but I didn’t realize it was not relevant in other parts of the world. There is a lot I don’t know about solar activity, but I was thinking that those indices would be the same for everybody because I assumed whoever is making the measurements is measuring something on the sun.
Oh well, no big deal, I’ll just add it to my browser and think no more of it.
NOAA has the 10.7 cm flux, which strongly affects the MUF and therefore which bands we can use effectively. HIgher 10.7 cm flux means bands like 17, 15, 12, and 10M become more useful for skip. Right now the solar flux is slightly elevated, so 17M is somewhat open during daylight, for long paths mostly. 20M is more open also - I heard EA2LU recently.
NOAA also has geomagnetic data - the K index shows how disturbed the magnetic field is - high K index can mean more QSB and loss on long paths, especially up north.
Spaceweather is good for keeping up with the sun and geomagnetic storms.
The SDO site has the most recent solar images in various wavelengths, especially EUV images that show the solar chromosphere and the corona. If you select the high-resolution images and magnify them, some of them are truly amazing. Right now we have an old sunspot group on the sun, and the images are much more interesting than the quiet sun we’ve had for a long time. You can see the magnetic fields and enhanced areas near the sunspots. Even if you’re not into solar physics, the pictures are incredible. Start with the 171 images and magnify them.