Hey all, I found the Facts and Figures page on the Database, and it’s cool! But I was wondering: is it possible to find or create more detailed breakdowns anywhere? For example, I’m curious to slice and dice the stats by time (e.g. “within the last year”), and place ("summits in W6/NC-*), and find out which combinations of band + mode were used successfully (by number of QSOs).
To make it more concrete, I want to answer questions like:
In the last 12 months, for activations in W6/NC-*, what were the top 20 {band + mode} pairs with the most logged SOTA QSOs?
For S2S QSOs in the above query, what were the most common Associations and Regions of the other summit?
If there’s a web frontend where I can explore the QSO data, that’d be really cool! But I’m not afraid to write my own SQL queries, if that’s what it takes… In another thread I found a link to the SOTA database JSON API, which would get me part of the way there, but it doesn’t appear to expose QSOs, just alerts and spots. Are there any other data sources or sites I should try?
There isn’t any more detailed breakdown available at present. We did have more information available in the past but it needs rewriting to work with the changes that happened with switch to SSO in 2020.
To be honest, the issue is typically more around indexing. With many millions of QSOs, slicing and dicing on unindexed columns ties up the DB for a while and slows everything down as it does a table scan. Indeed, the facts and figures page already is the page we use to test DB snappiness.
If you detail what you want we can often write endpoints for it, but it goes in the queue with all the other work we have on.
My personal view having worked on databases in the past and the endless queries that users can dream up is to sell a snapshot dump of the database in .csv format.
The buyer would get the same as the download QSOs or Chases. It is up to the buyer to build their own database and run their own queries. I would guess the dump of the QSOs would be about 650MBytes, the chase dump may be similar. It would not be unreasonable to sell it on the SOTA shop to help fund the database. How to price it I am not so certain but £20 a shot would not seem too unreasonable. A snapshot once a month would be adequate for trend analysis.
This would leave a question on copyright and preventing copying. I would address that by putting a few random spelling errors in the .csv file to make the copies unique. I wouldn’t imagine that copying would be a great issue.
Ok, that makes sense. I’m spoiled by my job, where we’ve got the resources to run ridiculously large queries; out here in the real world I guess compute resources aren’t actually infinite
I spent a little time thinking about this yesterday and trying to make up a wishlist for what I’d want, and I also came to more or less the same conclusion as Andrew: I think want access to the raw data, and if I can’t run my queries on the real database, I think the next logical step is that I want a copy. I’d be happy to pay a nominal fee to get the initial database dump.
But then my next question will be how to keep my database copy up-to-date. I don’t mind if the update frequency is limited (once a week would be more than enough; even once a month would be plenty), but I wouldn’t want updates to be a manual process every time. I didn’t have time to really dig into this yet, but I do think I’d probably want some kind of API for database updates, perhaps like “fetch all QSOs uploaded in the last 24 hours” or “the 10000 most recently uploaded QSOs” or something along those lines.
For my use case, I was planning to upload my copy to something like BigQuery, since even the free tier is likely enough and would let me build whatever visualizations my heart desires. BQ supports all manner of ways of getting data in, but I haven’t spent the time yet to figure out what would make sense for this.
My perspective: IMHO the point of charging a nominal fee when providing a copy of the DB is to reduce the number of times the DB admins have to do the manual work of making the copy. If so, then if users are providing copies to each other instead of making the DB admin do it, that sounds like a success to me. (Besides, even if you did discover someone making unauthorized copies of the database, would you really want to put up the effort to try and stop them? I know I wouldn’t…) But that’s up to you of course.
You also have to track all the records that might have been deleted, etc. By the end of it, you’ve implemented rsync again.
I think there may be GDPR issues with us giving out a full copy of the database, and I don’t feel like the tables that have GDPR information in them could be easily separated out, so I can’t see us providing that at present.
I can definitely understand why you wouldn’t want to tangle with GDPR! In that case, I think I’m limited to only asking for particular queries I’d like to see added to the existing stats web page. I won’t go too crazy asking for stuff, but I still think there’s potential value to adding a view like "what are people using now (say, in the last month or year), as opposed to all time. And maybe also “what modes are popular on what bands”. As a new user trying to figure out what equipment and skills I would need to get started, those were the first questions on my mind, and I found it pretty hard to answer them any other way today.
And maybe one more lower-priority one while I’m at it: are there any specific frequencies that people are commonly using? I’m guessing that one probably only has value if it can also be separated by region somehow, which I imagine could be tricky.
I remember I made up a page a few years ago for the SMP, which had these kinds of queries/requests. Nobody seemed to be interested in the page, so it was removed.
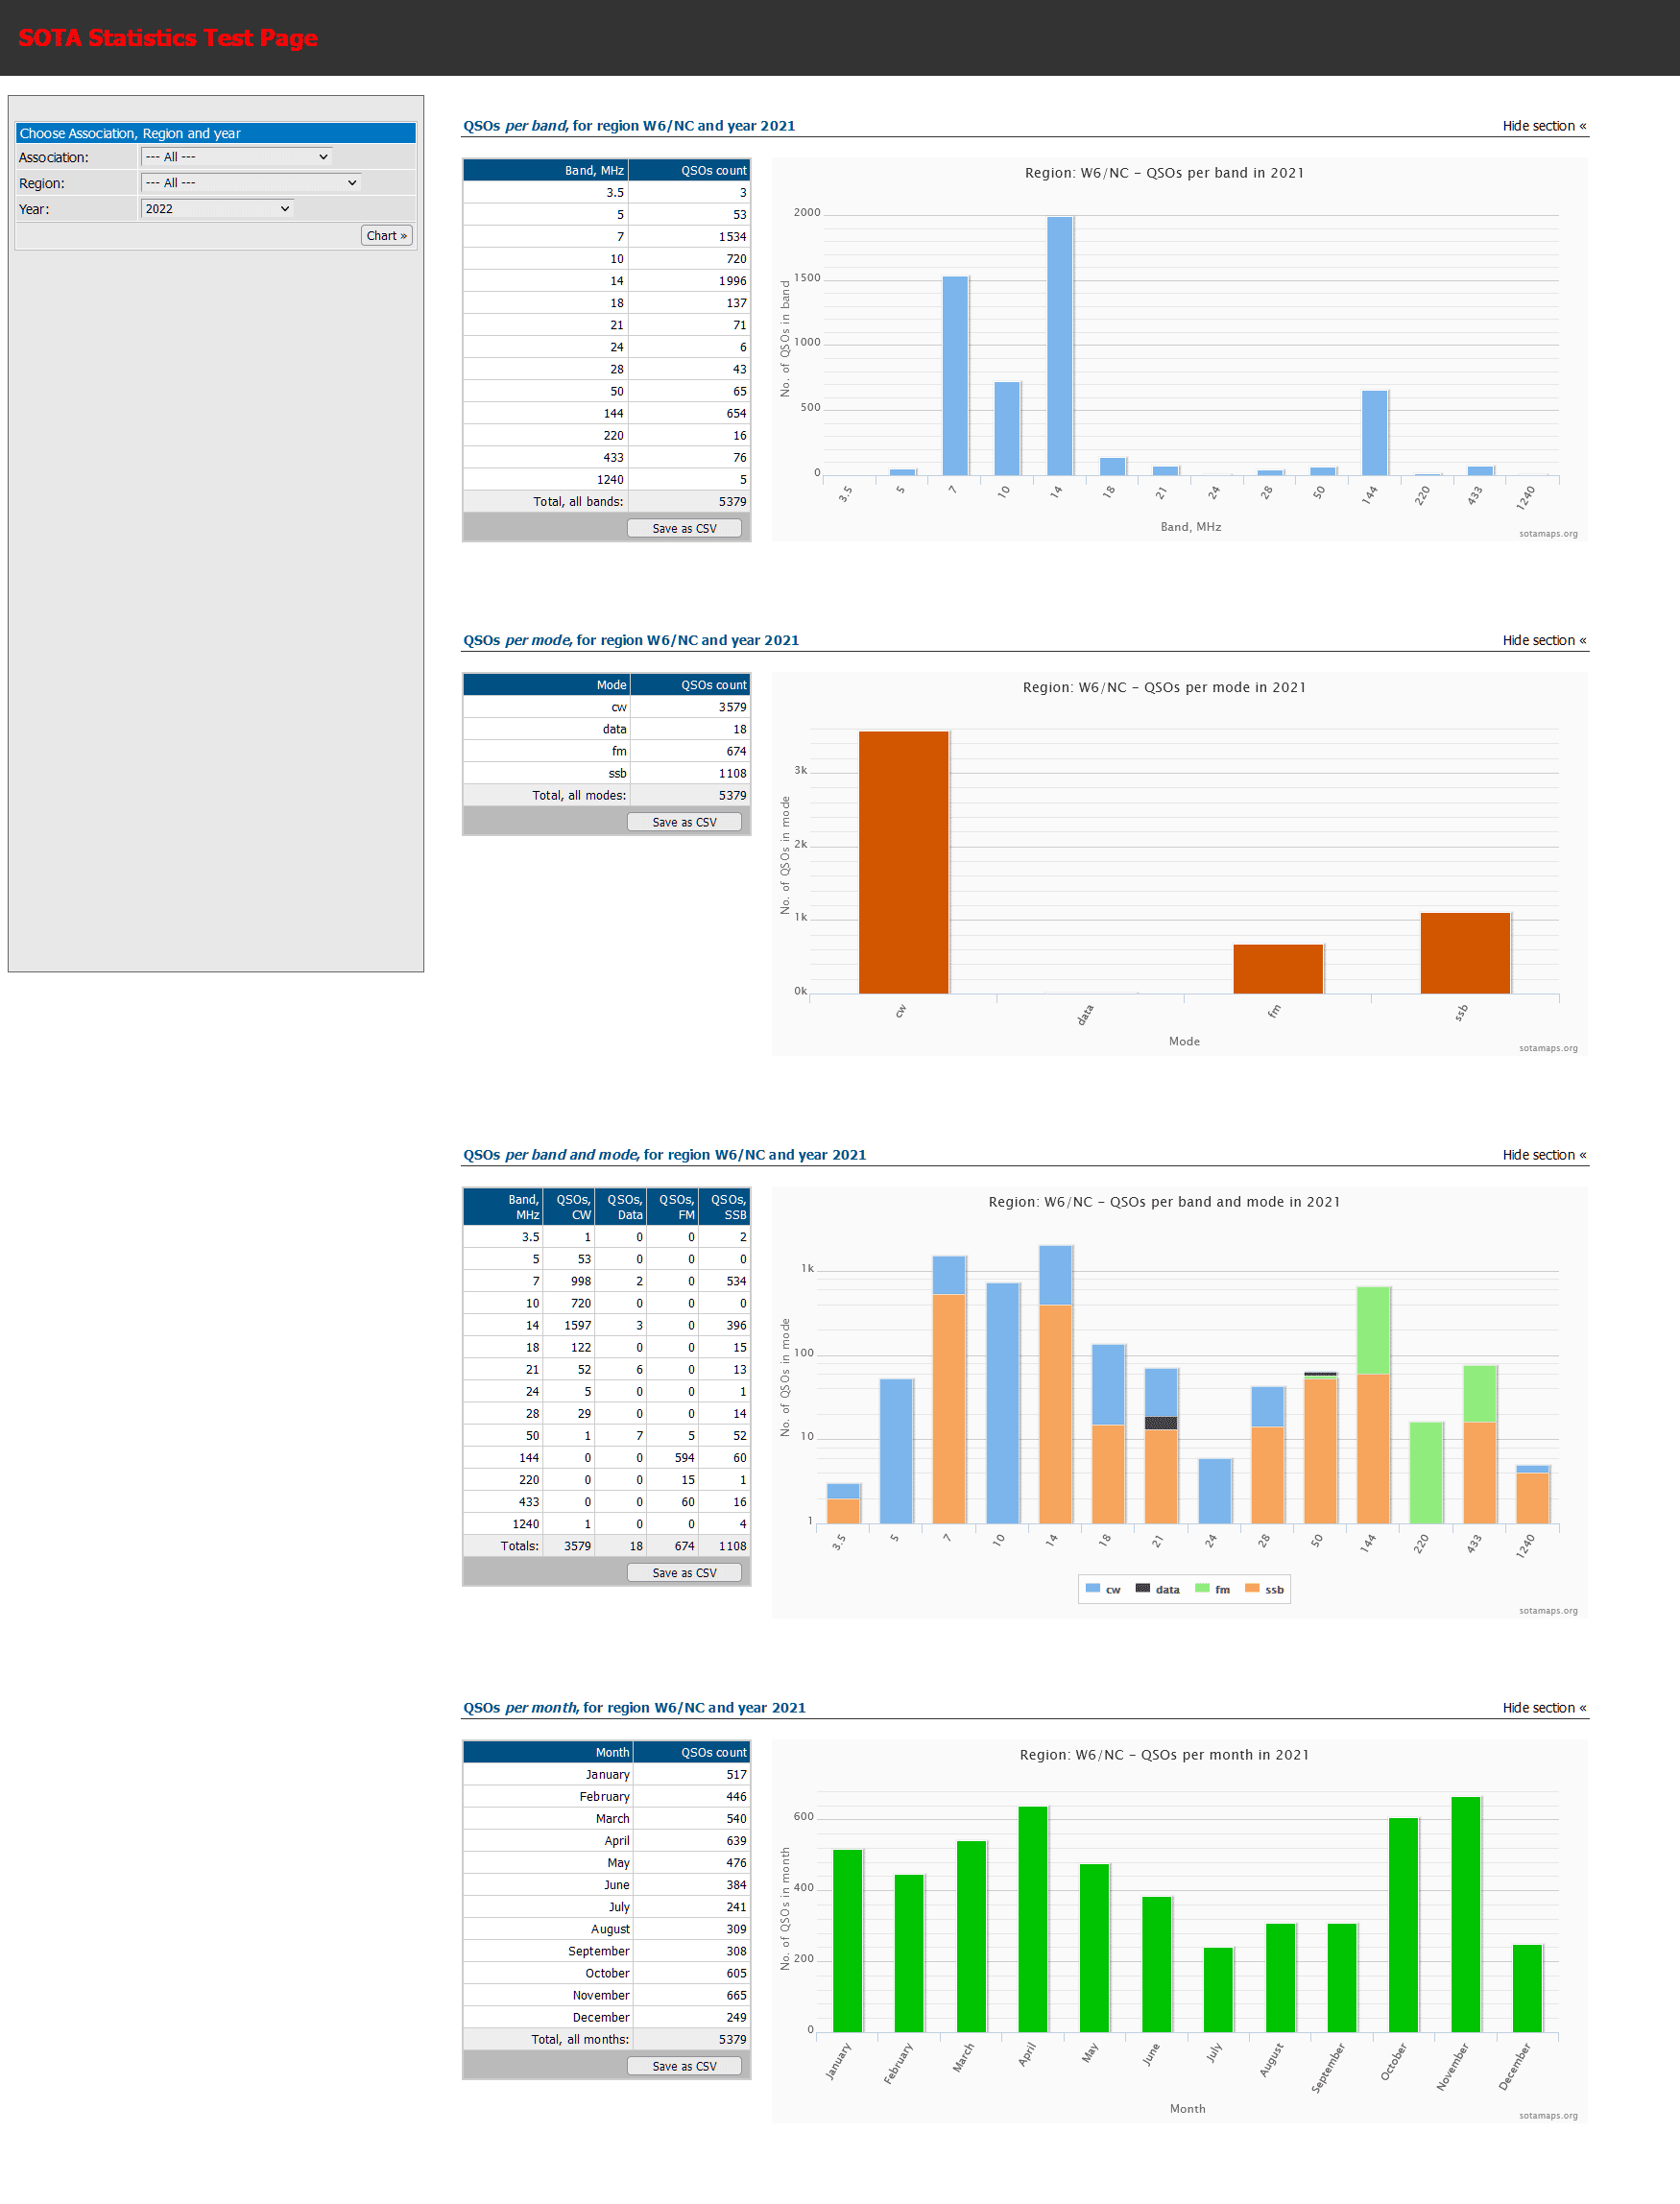
I’ve fired it up again, and it looks something like this:
That third chart looks almost exactly like what I was looking for! In fact, I like your stacked bar chart even more than what I actually asked for So yes, I for one like that page, even if I’m the only weirdo who likes looking at graphs…
Well, the SMP also has some graphs in the activations page, which others have admitted to liking, so there are perhaps more such fellow “weirdos” out there than you may imagine…
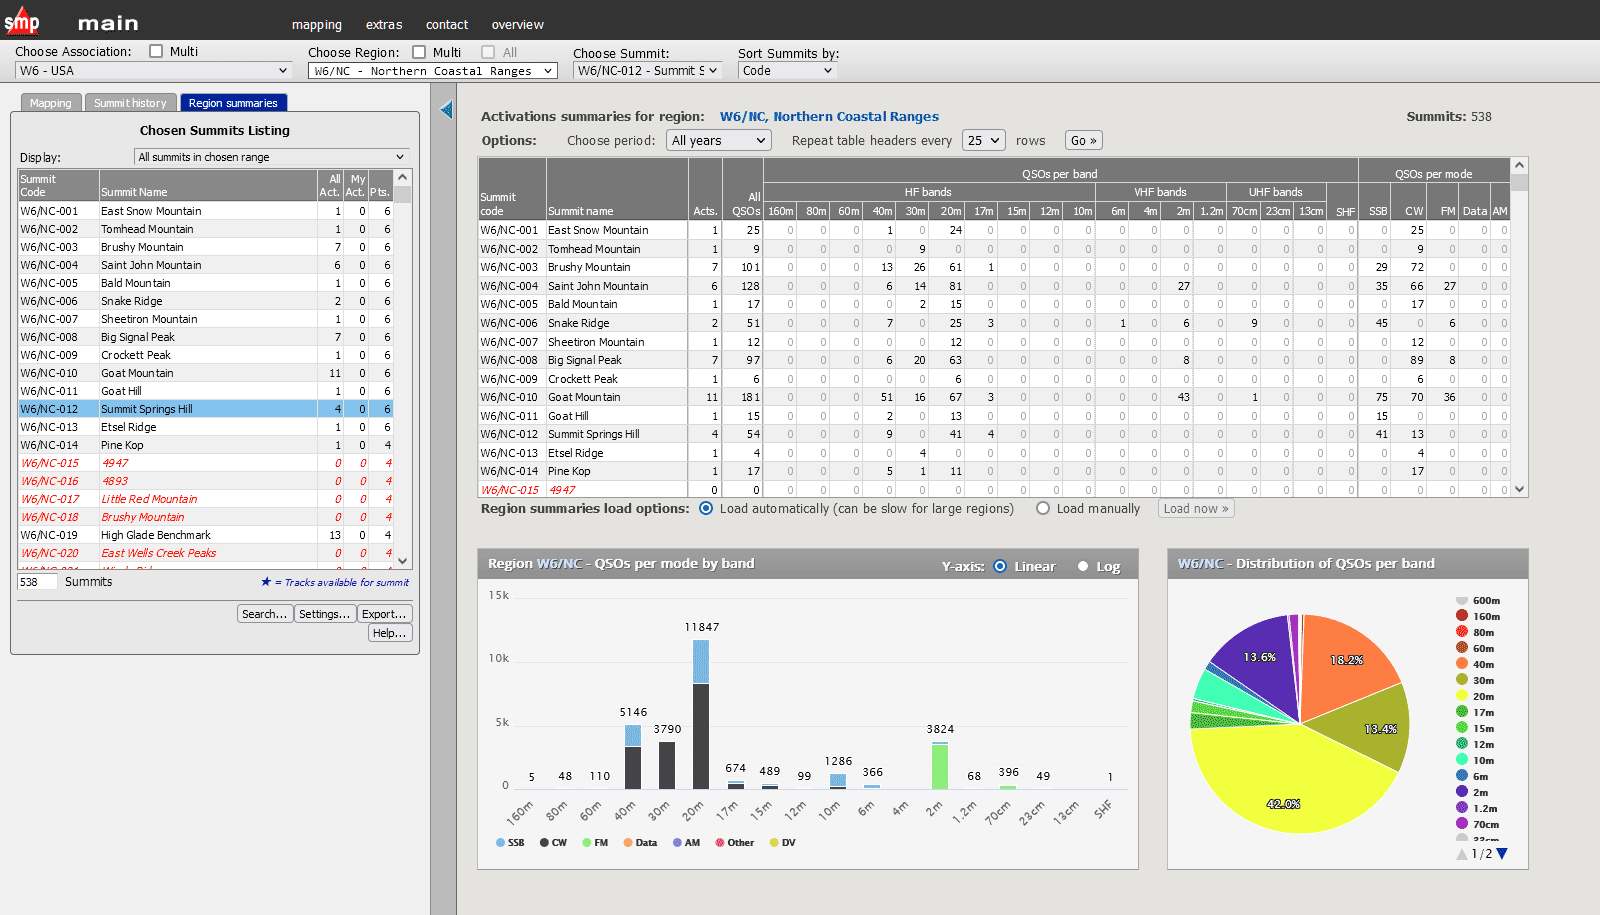
Having been away for some time, I haven’t used the mapping pages for a while, and so it had slipped my memory that a stacked barchart just like the 3rd one in the image above already exists in the SMP.
If you go to the main mapping page, choose a region, and click the “Region summaries” tab (upper left), a table of bands usage and charts of
will be displayed. I think you have to choose a summit first from the list of region summits to force the program to do the deep search by explicitly “asking” for it. Or something like that…
If you, or others, like the type of results page as in the first image above, and would like to have it or something similar available, you’d have to talk with the MT about that.
Hi Rob
Thanks for pointing out those stats. I ran the report for vk2/st and found some interesting info about bands and modes used.
The most interesting was that some intrepid activator has made contacts on 5 mhz. Not sure how they did that as we don’t have a 5 mhz band in VK. Maybe a logging error?
But seeing the breakdown of modes is also informative. It looks like over 95% of contacts were made using ssb. No wonder cw dx is receiving so few replies from vk.
Yes, there have always been (quite) a few such logging mistakes to be found in the database - some “intelligent” filtering is needed in the SQL queries or backend scripts to ignore some of the worst, such as FM on 160m, VLF reports and the like.
I put this down to the log upload facilities at SOTA being perhaps less efficient than they could be at catching such obvious errors before populating the db, but there are only so many hours in the day for the already overworked MT…
I’ve been spending a little spare time in updating my not-used stats page pictured above, and have for instance got some nice drilldowns on pie charts which tell their own tale…
It’s all very interesting once there is some data to analyse.
I was wondering what the percentage of contacts made were CW and although there were no overall (all-band) summaries I could find, the analysis was there for each band and that was quite informative. I like how it is possible to exclude one or more modes from that analysis by selecting the mode in the legend (is that the right word?)
Just going through some data and found one activation in 2021 where over 20 QSOs were made, split roughly half-and-half, on 24GHz and VLF. I’d love to see the antennas used on that one!
EDIT: I’ve now checked and the OM logging that activation, and others, regularly does do GHz activations, so it’s the VLF entries which are probably (?) errors.