Hi Andy, I understand that for people who may have entered their home QTH incorrectly. My point though was that the SOTAData is incorrectly plotting some SOTA summit positions.
No, it’s not plotting them as summits. If it was, there would be a triangle icon with the score in it. For some reason it seems that they are being considered normal chaser contacts. And it has 2E0BIA as Dennis not Martin.
I knew there was an issue. I just identified the wrong problem! ![]()
(Mind you we can all be excused for some degree of confusion when Martin leaves his normal habitat!)
Edit - just checked and the mapping software from the S2S log page shows the correct information for each of the examples I quoted (I had wondered if I had entered the details incorrectly with an erroneous space or something). The error seems to lie only on the activation log page in SOTAData.
The above discussion is above my head [I knew i shouldn’t have had that can of 6.5% IPA on an empty stomach just now].
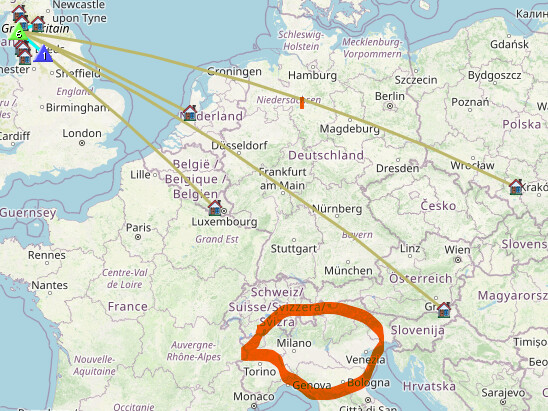
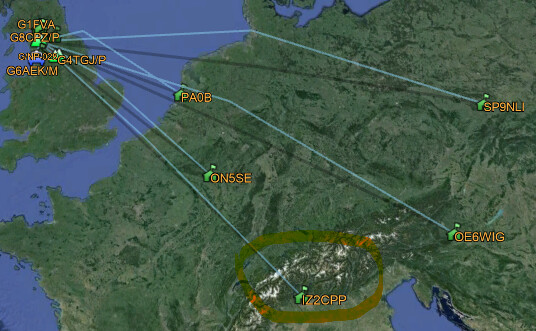
But could it explain why my 30m QSO with IZ2CPP today shown in my log doesn’t show in the SOTA log map …

… but does appear in ADIF QSO map?

Courtesy www.adif.uk/
The loc and lat, long in IZ2CPP’s qrz.com entry look good.
…doesn’t have a SOTA SSO account.
Please explain in layman’s terms what that is and why it matters? I understood any [non-repeater] QSO is valid for a SOTA log.
SSO=Single Sign On
If you log on to Sotawatch you are also logged into the database. Apart from the reflector you only need to log in once to access all SOTA systems.
If IZ2CPP doesn’t have a SOTA SSO account then the database doesn’t know where they are and so can’t plot the line. It doesn’t access qrz.com.
PS. Thanks for the 10m S2S today.
Righto. A hell of a lot of chasers don’t have a SOTA SSO account or anything to do with SOTA. If none of those contacts will have their QSO lines drawn, that severely limits the usefulness of the SOTA database log map. But good to know. Thank goodness for ADIF.
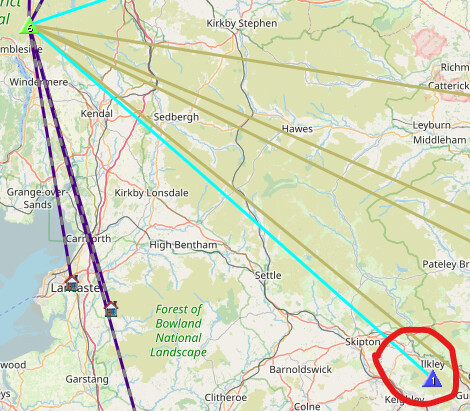
Thank you for the 10m CW S2S today. At least the SOTA map shows you!

And many that do have the wrong latitude and longitude so you end up seeing a QSO with somewhere exotic. Getting lat and lon swapped is common.
I’ve also noticed on aprs.fi that there are a lot of iGates in the North Sea. In this case they have forgotten to include a minus sign for west of Greenwich.
If it’s an S2S then it knows where the other summit is and presumably doesn’t care if the operator has an SSO account or not.
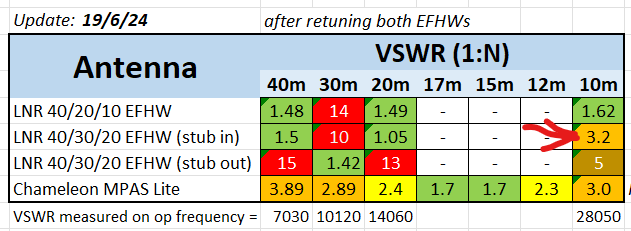
No, thank you. I used my 40m EFHW to call you. It works well on 20m and 40m but the SWR is high on 10m so I only ever use it for a quick S2S.
Funny you should say that because I worked you on my 40/30/20 EFHW!
After I re-tuned the antenna last month (shortening or lengthening the wire sections before or after the 30m link), I discovered the VSWR on 10m was similar to my Chameleon MPAS Lite vertical, so nowadays I prefer to take the EFHW if I’m doing both 30m and 10m.

And the KX2’s internal ATU makes it 1:1.0 anyway.
All of these “plot your QSOs” are just a novelty. Interesting and sometimes surprising results show up. But I don’t loose sleep if Europeans appear in the Indian Ocean or if QSOs are not shown.
In your opinion. Many of us find it very useful to see the geographical distribution of our QSOs visually for a particular activation rather than trying to imagine it from a table of QSOs.
It’s the only one that matters! https://www.youtube.com/watch?v=9CdVTCDdEwI
There are even those activators who find it very useful to examine such “geographical distributions of QSOs” to get some kind of an idea as to how their antenna is performing in general, and in particular even to get some kind of an idea as to how the (horizontal or vertical) orientation of said antenna affects the distribution of QSOs geographically.
And then there are those who may consider such information to have about as much value as a novelty toy. It really does take all sorts.
I guess it’s a function of how much ham you bring to your ham radio.