The subject comes up now and then: “Can’t someone survey SOTA summits in a new association XXXXX using freely available elevation models?”
As promised in another thread, here are some statistics comparing the accuracy of the free global Copernicus GLO30 30mx30m digital surface model and a national LiDAR 1mx1m elevation survey for identifying SOTA summits in NZ front country.
Note the the Southern Alps are not part of the LiDAR survey, so this does not test the accuracy in a true alpine environment - but it would be expected that errors will increase with gradient due to the large 30m squares in the free global Copernicus data. That said, elevations in the survey area ranged from coastal plains to 2800m ridges and peaks of the outlying ranges, so will be typical of many countries.
Number of SOTA summits
Percent
LiDAR identified
2152
GLO30 identified
2052
GLO30 missed
140
6.51%
GLO30 false positive
40
1.86%
Average error magnitude
Median error Magnitude
Average Error
-95.00%
95.00%
-99.00%
99.00%
Position (m)
62.54
14.96
235.91
1255.84
Prominence (m)
5.81
3.05
-2.93
-19.61
7.31
-41.89
20.85
Elevation (m)
5.94
3.53
-1.04
-18.39
11.85
-37.56
17.16
The GLO30 data failed to identify 140 p150 summits, and falsely identified 40 summits as p150 (150 meters of prominence) from a total of 2152 in the LiDAR survey area.
GLO30 generally underestimated both elevation (-1.04m avg) and prominence (-2.93m).
Mean, median of the error magnitude, and the +/-95% and +/-99% percentiles for the error in elevation, prominence and position are given.
Happy to play more or share the data if anyone is interested.
Not really sure what that says about the suitability of the copernicus data for identifying SOTA summits. Better than nothing (and probably better than our NZ map contours and spot heights - though I’ve not run those statistics).
Hi Matt,
Interesting analysis. Firstly it is necessary to accept that, with a few exceptions, the heights and positions of all SOTA peaks are wrong. It’s a matter of how wrong is acceptable.
A couple of years ago I compared State Government maps based on the Australian Geographic Survey data against OSM Toppo maps, Google Terrain, Every Mountain in the World and several other free maps. I have a paid for set of State government maps but the 1 m resolution ones are not available free (last time I checked) and my computer isn’t big enough to handle a whole State map at that resolution.
I think an uncertainty of 5 m in prominence is very good and a couple of metres in altitude is also very good as is 5 m in summit co-ordinates.
Sharp ridged summits are poorly measured by most remote measuring methods. You can’t do better than boots in the ground with.high quality survey instruments with a local correction station.
For SOTA, once a summit is recorded in the database that’s a defined set of values. Errors in summit position are usually obvious and the operator can relocate if necessary. Unless later measurements show a summit is not prominence compliant or it has a better measured height that changes which point band it is in then I would be inclined to leave the details alone.
Changing the definition of the Earth’s geoid shape, which has happened since 1987, could render previous mm perfect measurements in error by centimetres.
OSM Toppo is reasonable in identifying potential SOTA peaks. In a small area, examination of the data may show that the prominence and heights are well within acceptable bounds even given the known uncertainties of this App.
For example an island that has a dome shape and a mapped height of 200 m it is certainly prominent but will be in the 1 point band.
Thanks for discussing here from time to time how accurate our summits are measured. Each SOTA participant should be aware that this topic by itself is a science. As a member of the common people, I leave the measuring and listing to our specialists. However, I am aware that what is available does not always reflect the exact reality. In the end, our summit lists are what counts. At least until they are changed again, hi.
There are good and simple examples that demonstrate it this time and again. Take, for example, the precisely measured activation zones in Austria, which are shown as a green layer in Sotlas. The edge of these zones rarely coincides exactly with the simultaneously visible elevation curves of the free maps. How quickly one takes these thin lines, which look so official, as absolute truth.
I have found driving around VK5 and visiting some obvious summits with plenty of prominence then looking across a valley to a hill thinking that has to be a summit as well. But sadly proving to have the correct prominence is quite hard as in most cases these summits miss out by a metre or so on the mapping I have to prove other wise. There is no +/- rule in mapping summits. The line is drawn at that point and that’s the best we can do in a volunteer run organisation.
Regards
Ian vk5cz …
Well you definitely need to check the patently wrong ZL1/HB-033.
A loving god, rich in mercy, would not have made so rookie a mistake as to put the wrong summit 1m higher than the obviously correct summit next to the cosy Panakire hut.
Hmm. A little gelignite and some pick and shovel work could right this heinous mistake.
I assume the saddle to the hut is dipping down more than 25 m? In VK a road cutting transformed a HEMA summit into a SOTA summit so there is precedence.
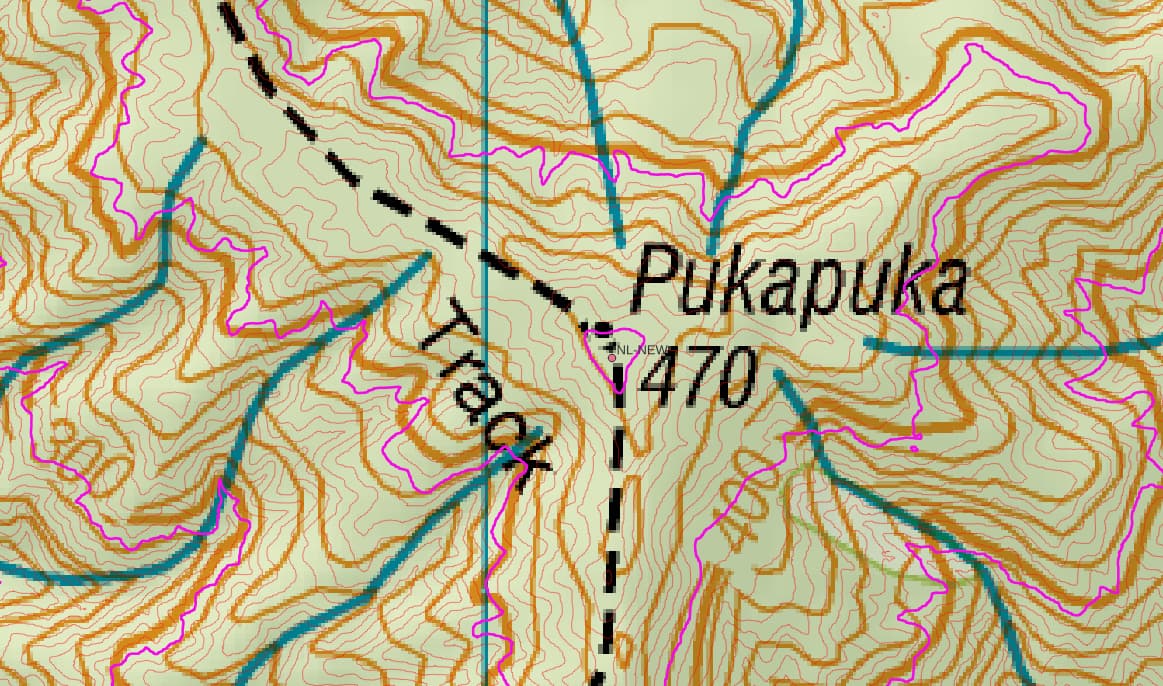
A good example of NZ govt topo50 map accuracy below. Purple contours are from the LiDAR survey. Thick contours at 100m, thin 10m. 510m at the summit from the LiDAR survey(the 510m contour line is too small to see on the image). Govt topo50 maps have it as 470m.
There are other examples where the elevations in the topo50 contours are accurate, but offset from reality by up to 100m horizontally.
Looking at mapspast.org.nz, you can see that the current topo50 contours have often been copied down faithfully (allowing for the shift from feet to meters in the '80s, and the projection change in the early 2000s) since the old hand-drawn map series of the 1940s and 1950s - so probably not a surprise. What was the survey technology back then?
Topomaps are all made from stereo aerial photo pairs, traced using a stereoscope plotter.
Here’s Lands and Surveys doing it in 1971.
IIRC the one in the geography dept in the '80s had shaft encoders on the pen axes to digitise.
When I was a teenager we had stereo aerial photos of the farm out the back of taranaki/waitomo, and one of the simple two lens stereoscopes to view them. We spent quite a lot of time during rainy august weeks studying them looking for tomos (dolines) that might hide cave entrances - the farm was riddled with them. You could see them on the stereo, but not even slightly in the single photos.
You could just buy copies of the aerial photos from aerial Mapping. It wasn’t too uncommon to take aerial photos on tramping trips, I recall the tramping club having a folder with quite a few, perhaps from before they had finished the inch to the mile maps. I also vaguely recall there were interim Fiordland maps with bits missing because they just hadn’t gotten photos of that bit through the rain
OK. Yes - I remember stereoscopic orthophotos - I spent a lot of time in my first job looking at them - though I can’t for the life of me remember why! Mapping land-use / land-cover class, I suspect.
You could certainly locate dips and bumps using them. But how do you translate from a stereo orthophoto into an accurate elevation or contour line? In the link you posted, see the plotter in the photo for drawing the contour line - but what is it in the stereophoto that gives you the accurate elevation?
You have to adjust the viewer to get the two photos in your left / right eye viewers / lenses to appear to ‘overlap’. And the magnitude of that adjustment must be proportional to the elevation difference from the plane to the ground. Right?