Free smartphone app tells you what band to use

Struggling on a mountain top with a geomagnetic storm?
Unsure what band to use?

Then this free, no-nonsense smartphone browser app with real-time local ionospheric conditions is for you!

hamwaves.com.swx.preview

3 Likes

Hmm. Viewing the collection of several images swiped/copied from other sites (e.g. NOAA), and a short summary table of other peopleā€™s work tells me what web-page masquerading as a ā€œsmartphone appā€ not to use.

I find it remarkable that you want people to donate ā‚¬10 for this piece of work.

Letā€™s just say itā€™s not for meā€¦ Best of luck with your project.

@DM1CM Thank you for your honest personal opinion, Rob.

Admittedly, at first glance, it might not be entirely obvious what sets this HF propagation dashboard apart from the many other available on the Internet.

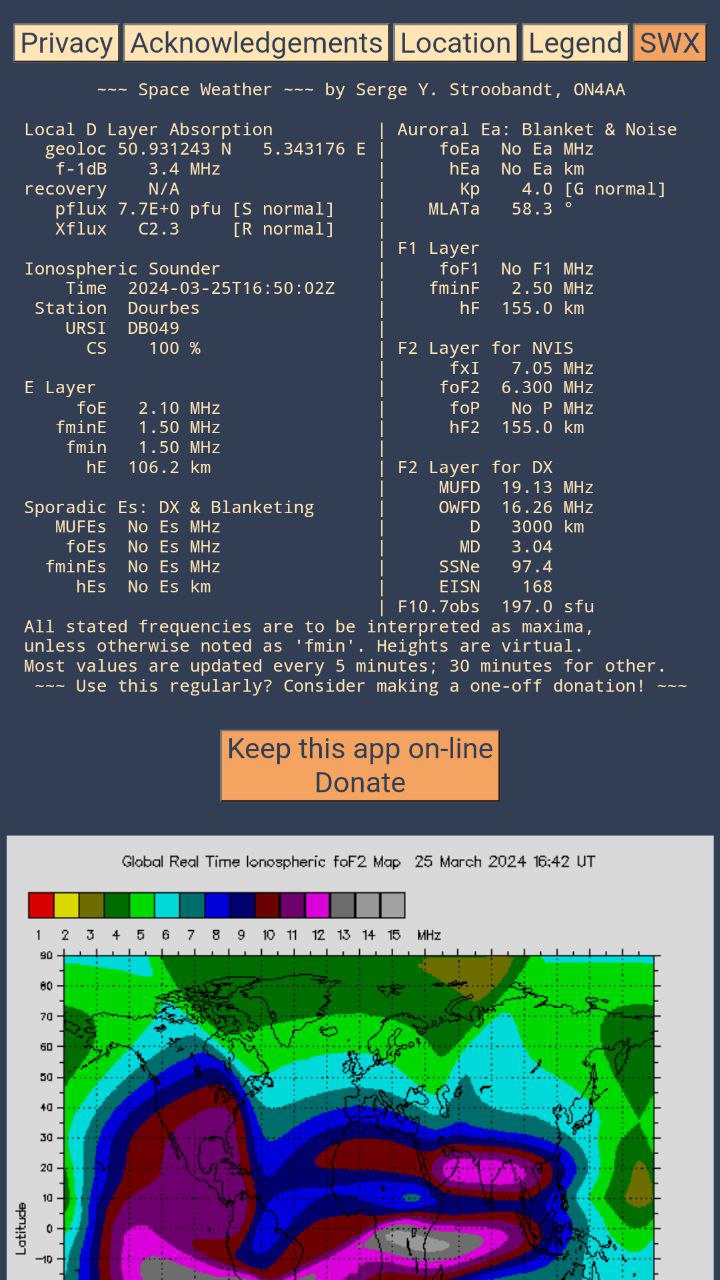
What is unique about it, is that it reports ionosounder measured critical frequencies of the ionosphere above you, which is important for NVIS. It also calculates the MUF of sporadic Es in real-time, and much more. The code is open-source and free to inspect. Behind the scenes there happens more than what you may imagine.

However, I do concede that getting to grips with interpreting the reported values may represent a learning curve. This can be overcome by personal study and using this real-time app whilst listening.

The images are precisely there to teach the effects of, for example, a high X-ray or proton flux on a worldwide scale. I donā€™t need them and that is why there is also a ā€œLiteā€ version without those.

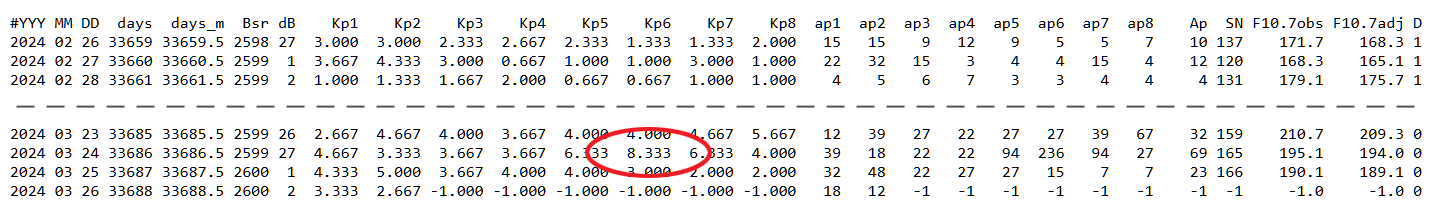
All data comes directly from the original sources, which renders the data near-instantaneous. For example: Last night, the app was one hour quicker than NOAA to report Kp = 8.3, as the app links directly with the GeoForschungsZentrum (GFZ) in Germany, where the worldwide magnetometer data is processed. Most dashboards you see on the Internet are outdated by at least one hour and many even by 24 hours.

A brief history about this dashboard: An early precursor of this app ran as a web page since May 2016 and became wildly popular over the years. It broke due to API and hosting service changes two years ago. Around the same time I fell seriously ill. In the mean time, I received numerous e-mails nagging and begging me to restore this service. Now, that I am finally recuperating from my invalidating chronic condition, I set about to do just that and better. So, this was really by popular demand. The web site statistics are there to show. Oh well, pearls for the swines, I guessā€¦

As for the donation request; This is a free (as in beer) app, and it always will be. No one should feel coerced to donate. On the other hand, hosting hamwaves.com and e-mail costs over ā‚¬15 a month, ā‚¬21 starting next year. (Any cheaper suggestions are welcomed.) Donating might not be a thing in Europe, but it is in other parts of the world. Over the years, I have received numerous ā‚¬10 donations, not only for this app, but also for the unique and peculiar RF calculators. Thank you! It does not cover my costs entirely, but contributes significantly, especially given my situation. I also donate to projects that are of significance to me.

Destroying something only takes a minute, whilst building something useful takes more timeā€¦

Hopefully, there will be more positive and constructive reactions to be read hereā€¦

3 Likes

I like it. Thank you.

1 Like

OK, well I loaded this web app in my smartphone browser, and it looks well enough. But being a web app, itā€™s dependent on there actually being an internet connection, which is not often the case when one is on a summit, and which limits itā€™s usefulness as a ā€œreal-timeā€ app for SOTA activators, IMHO.

This is more a question of luck of timing than anything else: the GFZ Kp and Ap data are updated every 3 hours:

so if your app timer hits newly updated data from GFZ sooner than some other ā€œdashboardā€, itā€™s just a matter of luck, or your app firing off more frequently than others.

As the inline comments in your python code indicate, this calculation is achieved by multiplying the critical frequency foEs (got from GIRO every 60 minutes, so hardly ā€œreal timeā€) by a factor of 5.3, a figure gleaned from this reprint of a 1988 QST article: Sporadic-E Propagation at VHF, section ā€œThe Classical ā€˜Eā€™ Skip Modelā€ . So, a calculation, yes, but hardly especially noteworthy?

Notwithstanding my nitpicking, Iā€™m sure many will appreciate your app. I doubt Iā€™ll be using it, thoughā€¦ Maybe Iā€™m just not a pearl person?

1 Like

ā€œPeople always call it luck when youā€™ve acted more sensibly than they have.ā€ ā€”Anne Tyler

@DK3RN Thanks for the encouragement, Peter.

I made a couple of improvements, rendering the data even more instantaneous in several ways.

Reload the web page with CtrlShiftR or clear the browser cache on your smartphone to see the updated version of the app. Otherwise, it takes one week for your browser to realise there is an updated version.

You will know to have the latest version when you read the line:
Updated every minute for Xflux; 5 & 30 minutes for other values.

1 Like

By popular shack sloth demand on Reddit:

A new version of the no-nonsense propagation app with Maidenhead grid locator entry is now available. To use the new version straight away, first empty the browser cache with Ctrl+Shift+R or equivalent.

The desktop experience will now also be better. Printing to PDF, for example, was also improved.

1 Like

I have added a bunch of Australian :australia: ionosonde stations today. Tell your Aussie buddies! :wink:

2 Likes