Phil, I’ve used Radio Mobile to generate coverage maps for 2m, 70cm and 23cm for my home QTH and some local SOTA summits, e.g Arnside Knott G/LD-058 145.0MHz 5W 3.0dBi omni antenna Copyright Roger Coudé Canada 2005
You can create site profiles and antenna profiles and use in combination to produce a specific coverage map at a particular location, antenna type & height and Tx frequency & power. https://www.ve2dbe.com/rmonline_s.asp
Very good info guys, thanks. With experience I tend to know whether to both to rely on 2m or not, which is the only VHF band I use on SOTA activating. So if I have any doubt I don’t tend to bother with it and use the blunt instrument of HF, where there is a guarantee of success everytime, 100% unless something breaks before the 4th QSO. I can’t see this LoS terrain measuring program being any use to me therefore, although I can appreciate for people using UHF and microwave like you’s it would be very useful indeed.
That is indeed a very useful tool, especially for longer ranges and S2S, but I find it optimistic when there is a hill between the stations. For example it thinks from my home QTH I should be able to reach GW/SW-015 on 2M, when I know very well that the bulk of the Black Mountains are in the way …
I used to use and create models of systems and subsystems in my former engineering career and all modellers will tell you, models are an abstraction of reality and their effectiveness depends on what real-world factors you choose to include or not.
I can see that the Radio Mobile model does take topology (e.g. the hills) into account but modelling the attenuation thus caused must be a tricky thing. Sometimes, the model will be too optimistic and sometimes too pessimistic. I very much doubt that it takes day-to-day variation in propagation (e.g. tropospheric ducting) into account. It’s best to use coverage models as a general guide.
I’ve found in G/LD land I often get QSOs on 2m and especially 70cm where the line of sight is blocked by mountains and I put this down to signal reflections. I recall getting ‘impossible’ contacts on VHF/UHF where the north-south length of Lake Windermere was somewhere close to but not on the LoS path.
So far for SOTA, I’ve only ever tried using Radio Mobile “after the fact.” When looking at the predicted plot, it’s interesting to see that every QSO, even the very surprising QSOs from places I was not expecting, all fall within the predicted coverage area.
It is however, very optimistic. You can enter fudge factors however, by limiting your antenna gain and height, and that of the theoretical receiving station as well. I know my antenna is about 3dBi gain on VHF, but you can fudge yours or the receiving station’s dBi if you want a less optimistic plot closer to your observations, then apply those in a different location to predict what you might get.
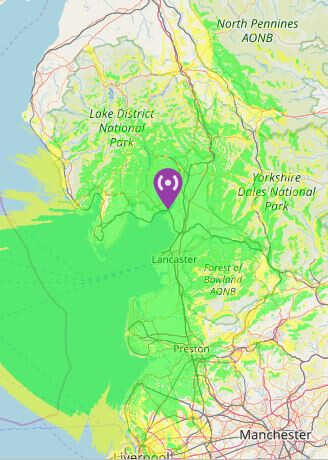
Hi Austin, I assume you think it’s optimistic based on the strong signal (green), weak signal (yellow) and little or no signal (white) zones on the coverage map you generated.
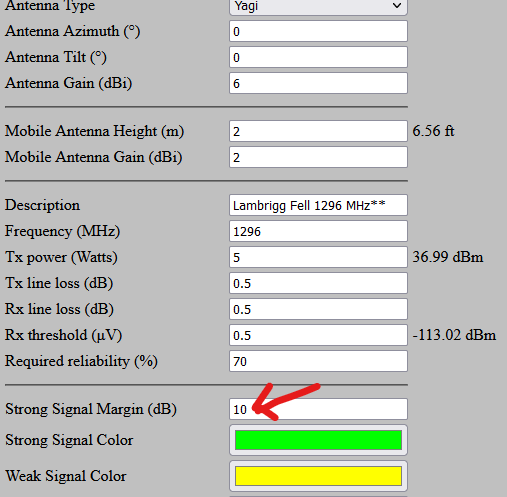
Rather than ‘fudge’ the input variables (with unknown results of the model’s behaviour) it might be better to customize the thresholds for strong / weak / no signal to suit your expectation.
Towards the bottom of the New Coverage menu, the Strong Signal Margin seems to default to 10dB. I tried changing it on one of my existing coverage maps (23cm Yagi on Lambrigg Fell). If I increased this value, the strong (green) and weak (yellow) zones shrank compared to the default setting.